A 3D Density Map of Environmental Risks in the U.S.

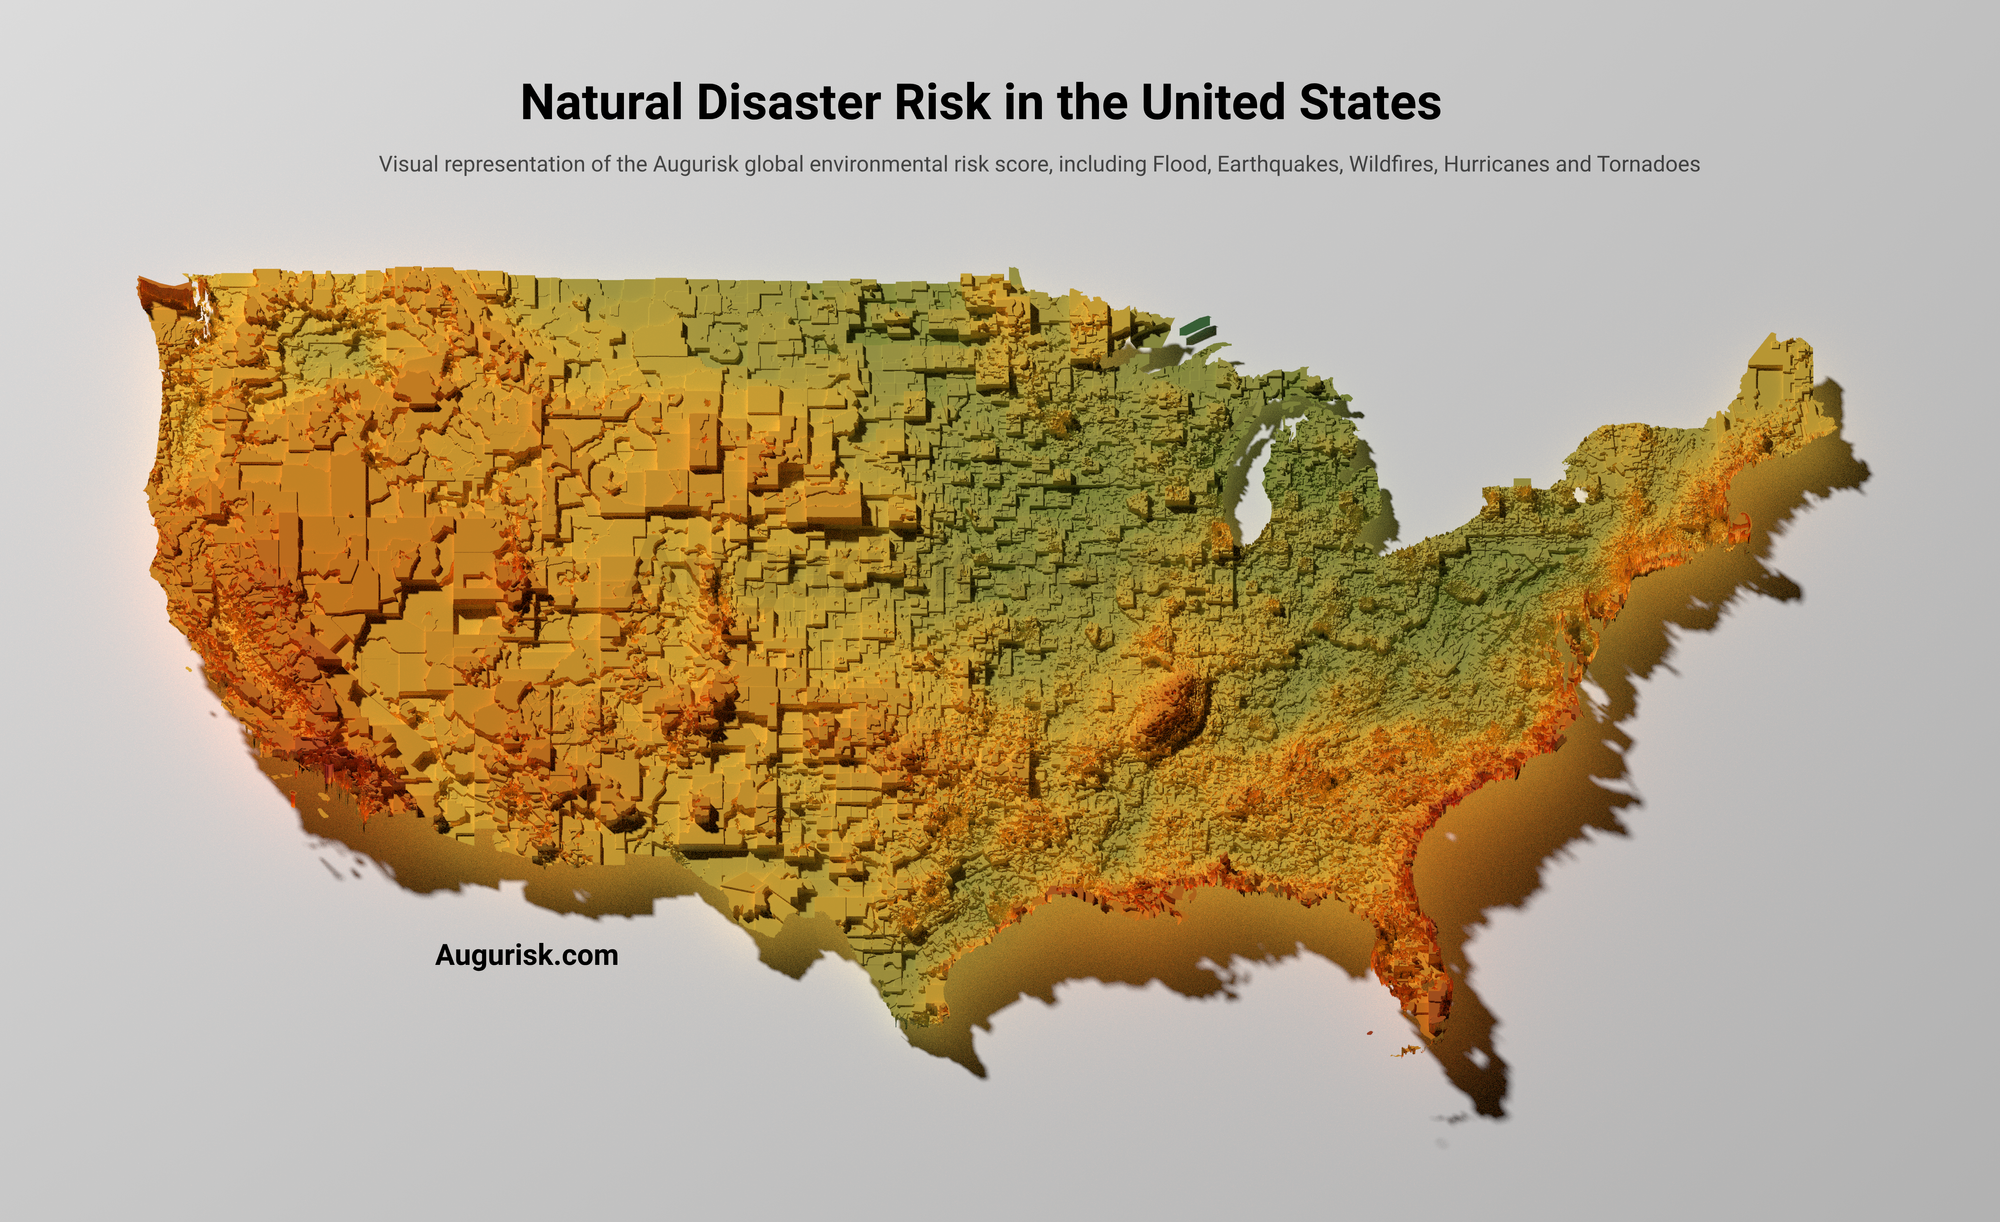
The changing climate has brought unprecedented environmental challenges to our doorstep. With wildfires becoming more rampant, hurricanes intensifying, and other natural disasters redefining our relationship with nature, there's a growing need for accurate, granular data to inform decision-making. Augurisk has developed an innovative visual representation to better understand the environmental risks posed across the United States.
Here's how to interpret it:
- Color Spectrum: The transition from green to red signifies the range of safety to danger. Green census blocks are relatively safer, while red ones indicate heightened risks.
- Elevation (z scale): The elevation of each census block visually amplifies the risk factor. The higher the elevation, the greater the environmental risk.
A Composite Index of Multiple Threats
The Augurisk Environmental Risk is not based on a singular threat but is a composite representation of various environmental risks. This includes:
- Floods
- Wildfires
- Earthquakes
- Hurricanes
- Tornadoes
- Snow Storms
- Hail Storms
- Volcanos
This multifaceted approach ensures that residents, policymakers, businesses, and developers can gain a comprehensive understanding of the challenges their regions face, allowing for better preparedness and more informed decision-making.