Augurisk updates its crime data
Augurisk has released an update on its crime data, available everywhere throughout the United States down to the Census Block Group resolution.

Detailed, high resolution crime data has many important use cases. From a public point of view, It can be used to prioritize public action for law enforcement and social services, as crime roots itself in numerous social factors.
Crime data is extremely useful for corporations as well to identify crime risk exposure, improve risk management policies and improve their algorithmic models.
For individuals, it provides more situational awareness and general insights on the neighborhoods of potential new homes.
Risk is always part of our lives, and risk assessment is an essential part of emergency preparedness planning.
This being said, detailed, high-resolution crime data was only available for a few major U.S. Cities, which cover less than 10% of the U.S territory. Alternative data sources from the FBI’s Uniform Crime Report program (lately, NIBRS) exist, but provide a county-wide resolution that is insufficient for accurate risk assessment.
For this reason, last year, Augurisk released its crime risk assessment, using our crime risk prediction ML algorithm. We filled the gap in granular U.S. Crime data by combining social sciences expertise, artificial intelligence, and data science. We trained a machine learning algorithm to predict crime based on partial crime data alongside 188 additional predictors. We thus managed to generate Census block group level Crime data - whether observed or predicted - anywhere in the U.S., with up to 77% accuracy. A paper was published in an international, peer-reviewed scientific journal detailing the methodology.
Today, we’re announcing an update to our crime risk assessment algorithm, involving more recent data, additional predictors and training data which result in a higher performance and better prediction accuracy.
Here’s a summary of what’s changed for the Crime risk prediction algorithm V2:
*: as measured by the ability to predict whether an observation lies in the 1st, 2nd, 3rd, 4th percentile or above the 98th percentile. The term ‘up to’ refers to the fact that this statistic is calculated among all block groups in our training and test data. Excluding training data from the sample lowers performance to 64%.
Training data
When it comes to modeling, more data is always better. Therefore, this update increases the number of cities used in our training data to 15. New cities include Memphis, TN, Nashville, TN, Seattle, WA and Saint Louis, Missouri, where data is now observed instead of being predicted. This increases the number of block groups from 13,897 to 17,476, now representing about 8 % of all areas in the U.S.
Years considered
We took advantage of the recent release of ACS 5-Year estimates to update our predictors. The years considered to train the algorithm are now 2015-2019.
Predicting factors
14 new predictors have been incorporated, based on insight provided by our research. Sometimes, the density of specific points of interests - such as restaurants or banks, for example, can affect crime dynamics in an area. Therefore, the new predictors also include nearby points of interest such as restaurants, bars and pubs, bus stations, casinos, prisons, nightclubs and more.
New Crime type
The first version of our algorithm provided data on 4 crime types:
- violent crime (including simple assaults)
- property crime
- Two property crime subcategories:
- Vandalism
- Motor vehicle theft.
The current version provides an additional violent crime subcategory, simple assaults, which refers to incidents where no weapon were used, which resulted in no serious or aggravated injury. This can involve intimidation, coercion, hazing…
Performance
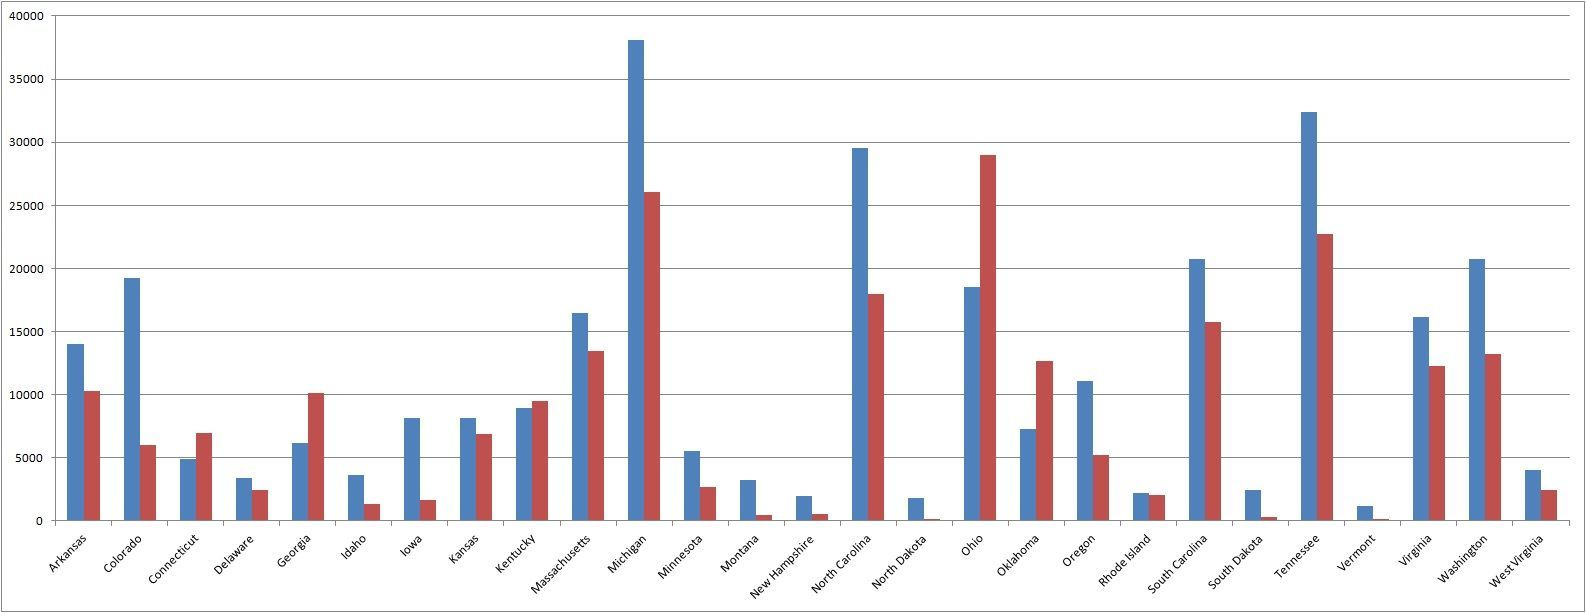
The performance of our predictions is difficult to measure outside of our training data, as we lack comparable data sources - which is precisely the reason we created this assessment in the first place. However, we can see a comparison of our aggregated data at the state level in the following graph, which presents our violent crime predictions V2 compared to NIBS crime data:

Overall, the mean absolute errors for violent crime, property crime, vandalism and motor vehicle theft oscillate between 35 and 37.7% of the target means. In other words, on average, if 100 crimes occurred in an area, our algorithm could predict between 62.3 and 127.3 occurrences. There is a 74% correlation between our state-level predictions and the NIBRS data. This improves our performance compared to last year’s results. The following two tables provide information on our performance, by first focusing on Mean Absolute Errors, and then providing a measure on our improvement by relating it to the mean of the variable we intend to predict:
*: New crime category
**: The percent change indicated is expressed as the change in percentage point (not a percent change per se). A decrease in the ratio MAE/Target mean is a sign of improvement, as the error decreases when we take into account the extent of the average number to predict.
Rural areas and NIBRS calibration
Because our algorithm is trained on urban contexts, its performance is higher in urban areas. In States where a higher proportion of residents can be considered as rural, predictions can seem lower than the estimates provided by the Federal Bureau of Investigation’s reports. This limit is visible for States such as North Dakota, Maine, or Vermont. We therefore introduced a statistical correction by calibrating our predictions using NIBRS estimates in rural States.
What’s next
Our team is already working on the next version of the crime prediction algorithm, with exciting new features. We are closely observing the differences between our predictions and alternative crime data, improving the performance of the next iterations as well as adding new dynamics to our algorithm.
Keep an eye on www.augurisk.com for more on what’s coming!