Covid-19 and unemployment: who were the hardest hit?
The early 2020 Covid-19 outbreaks generated unemployment spikes throughout the U.S. Who were the hardest hit, and did the recovery take place?


Last year saw the rise of a major health crisis. Alongside the litany of covid-19 cases and deaths, a significant economic crisis emerged. Unemployment in the United States was severely impacted by the Covid-19 pandemic and its associated restrictions: between February and April 2020, unemployment rose from 4.3% to 12.4% nationally and has yet to fully recover.
U.S. Monthly unemployment average, Feb. 2020 - Jun. 2021
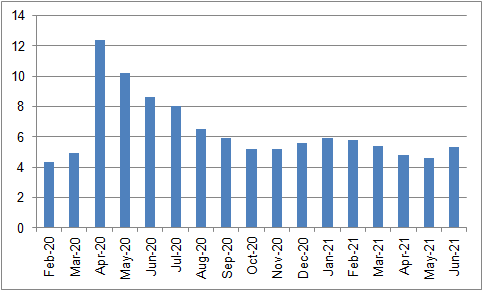
Source: U.S. Bureau of Labor Statistics monthly county unemployment data.
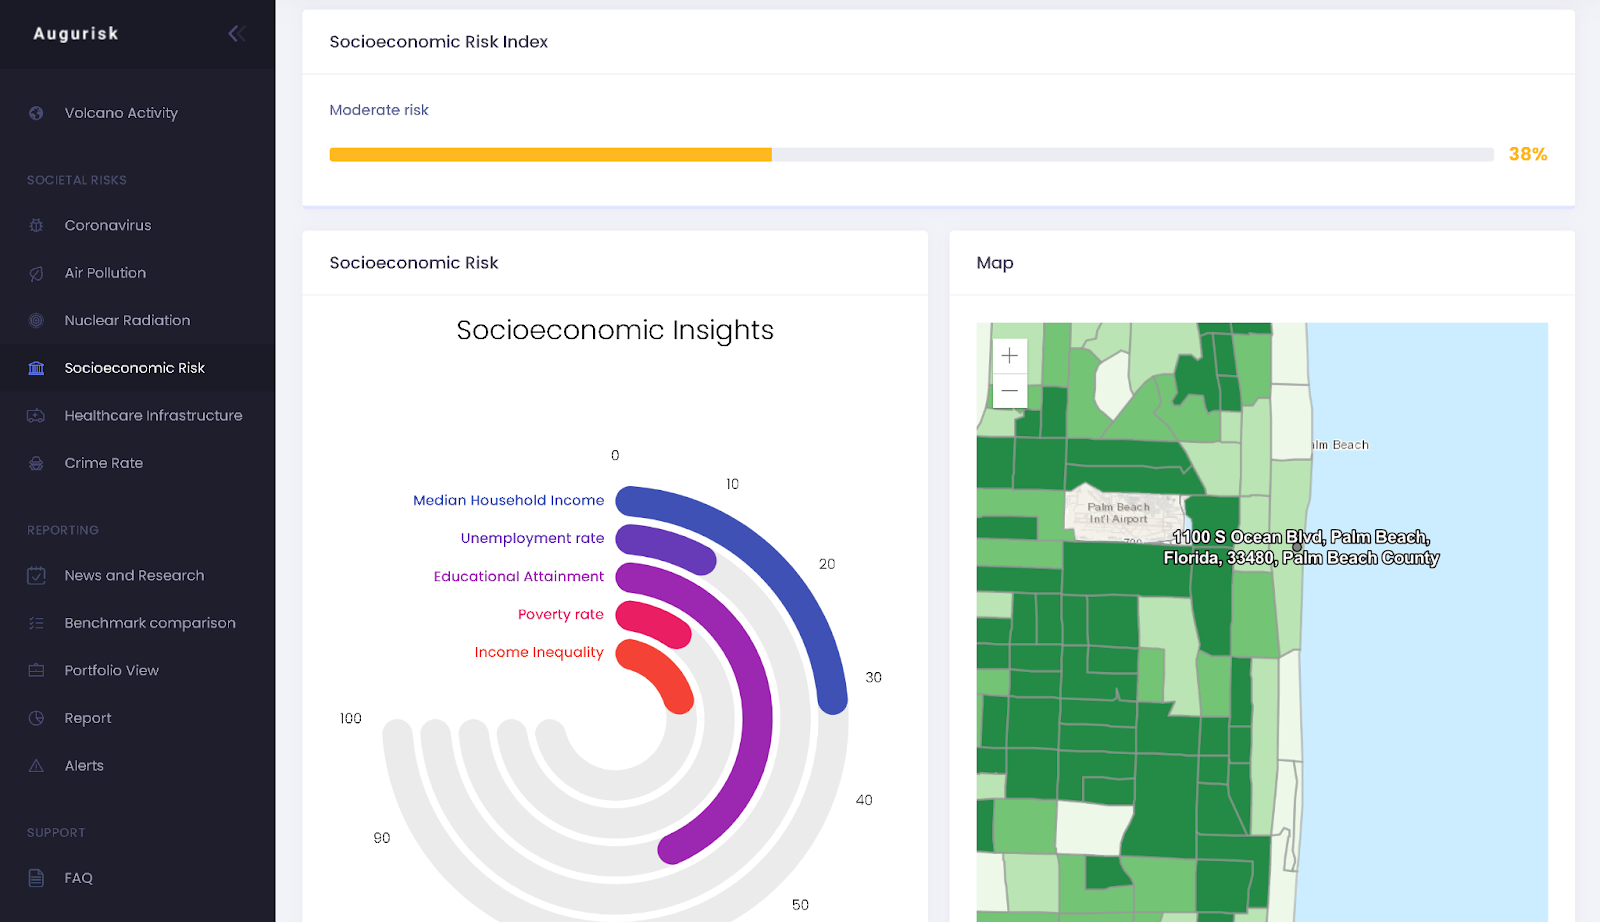
Witnessing this crisis aroused our curiosity about its impacts on society. Our socioeconomic index, measuring social and economic risks associated with living in a county, provided us with a way to do so. This index, ranging from 0 (the lowest risk) to 100 (the highest risk) is based on several indicators, including the median household income, the unemployment rate, educational attainment, income inequality, and the poverty rate.
How were the ‘riskiest’ counties (i.e. with high scores), where unemployment was already high before the crisis, affected? Inversely, were the ‘safest’ counties with low scores, where unemployment was generally very low, affected at all? In other words: were the poor communities disproportionately hit by the crisis?
In response, this article attempts to shade light on two aspects. First, which counties were the hardest hit? Were they the most economically advantaged? Disadvantaged? Second, could they recover, and to what extent?
Throughout this article, we will attempt to answer those questions using monthly unemployment data from the U.S. Bureau of Labor Statistics from February 2020 to June 2021, along with Augurisk’s county socioeconomic scores.
Counties that suffered the most
The 5 counties hardest hit
As the U.S. discovered Covid-19 and its consequences around March 2020, unemployment rose from 4.3 % in February 2020 to 12.4% in April 2020 nationwide. The following 5 counties were the most hardly affected, with unemployment spikes of up to 31.2 points of percentage:
Source: the U.S. Bureau of Labor Statistics, ibid.
Maui County, Hawai, was the hardest hit by the unemployment surge during the early 2020 Covid-19 outbreaks and lockdowns. Its unemployment rate rose from 1.7% in February 2020 to 32.9% in April 2020. LaGrange County, Indiana, saw the second highest rise in unemployment (from 2.5% to 32.7%). Generally speaking, Hawaii paid a significant tribute to the Covid-19 economic crisis, as Kauai County is 3rd in the list (from 2.5% to 32.7%). Las Vegas comes in 4th, as unemployment in Clark County, Nevada rose from 3.6 % to 33.3 % between February and April, followed by Atlantic County, NJ (6% to 34.4%).
A quick look at their scores suggests these counties are not usually subject to socioeconomic risk (at Augurisk, we consider a score between 30 and 50 to be intermediate). However, the importance of tourism in their economies is a potential explanation for their unemployment surges.
Were the economically disadvantaged disproportionately hit?
To answer this question, we will use the Augurisk socioeconomic score as a measure of disadvantage. The higher this score, the lower the median household and educational attainment, and the higher unemployment rate, poverty rate and income inequality. Keep in mind the score starts from 0 (the lowest disadvantage) up until 100 (the highest disadvantage).
To begin with, counties with the lowest socioeconomic risk scores began the crisis with lower unemployment rates: while counties with a score under 10 had 2.2% unemployment rates on average, counties between 60 and 70 had a 6.2% average, up until 12.9% for the riskiest counties (score over 90). Nevertheless, the crisis hit every socioeconomic class defined by our index, although not to the same extent. The following table details the average initial situations and the average difference in unemployment between February 2020 and April 2020, by socioeconomic risk score:
Interestingly, the crisis created a bit of a mess in employment situations. Before Covid-19, counties with a lower score had a lower unemployment rate, as clearly indicated in the previous table’s second column. Afterwards, the trend persists, but a few exceptions emerge.
The most important observation here is that the crisis hit all counties: unemployment increased by 6.1 to 9.8 points of percentage across categories. Although the safest counties saw the lowest increase in unemployment (6.1%, against the 8.1% national average), this category only involves 7 counties nationally, and other categories with high risk scores can also experience similar unemployment spikes. However, as the riskiest counties started out with higher unemployment rates, the crisis worsened a situation that was already problematic. For example, counties with a score between 60 and 70 had around 6% unemployment before the crisis... and 12.8% afterwards. Thus, economically disadvantaged counties experienced similar increases in unemployment, which created even more challenges than before. The most economically advantaged counties saw lower unemployment spikes, while the vast majority of counties (with scores between 20 and 70) observed unemployment increases by 8 to 10 percentage points.
Who recovered, and how fast?

The following table recapitulates the time it took to go back to pre-Covid-19 unemployment levels by Augurisk score. Because most counties never fully recovered as of June 2021, we also provide the proportion that did:
The most economically advantaged counties (scores 0-20) barely recovered from their unemployment spike as of June 2021: it took 8 to 9.4 months on average to recover, while only 14 to 24% of such counties succeeded to reach their pre-covid-19 unemployment levels. On the contrary, while economically disadvantaged counties faced impressive unemployment rates due to the crisis, they recovered faster (between 4 and 5 months for counties with a score higher than 70) and more frequently (50 to 67% succeeded for the same category). About 50 to 60% of the ‘middle-class’, in between, recovered in 6 to 7 months.
Conclusion
The economic crisis associated with the 2020 Covid-19 outbreaks generated a significant spike in unemployment across the country, affecting both economically advantaged and disadvantaged counties by similar margins (6 to 10 percentage points). The counties hardest hit in terms of unemployment are Mauai and Kauai Counties, Hawaii, LaGrange, Indiana, Atlantic County, New Jersey, and Las Vegas' Clark County, Nevada. In economically disadvantaged counties, where unemployment was already high before the crisis, this created particularly serious challenges, but the recovery (that is, the time it took to go back to pre-covid-19 unemployment levels) occurred faster and in a higher proportion.
Socioeconomic Risk Assessments with Augurisk
Augurisk is a risk assessment platform for 11 natural disasters and societal risks, including the socioeconomic risk assessment.
You can generate a risk assessment for any property anywhere in the US. Create a free account by clicking here and generate your risk assessment!