Augurisk crime prediction algorithm v3
Augurisk releases the third version of its crime prediction algorithm

We are pleased to announce the release of our new Augurisk crime prediction algorithm.
Continuing to build on our original, peer-reviewed research, this update — Version 3 — offers some noteworthy improvements.
New features
The main novelty of this year’s model is the introduction of a ‘universal’ version that does not rely on ethnic variables for prediction. After listening to feedback from the Augurisk user community and considering discussions about the challenges of using ethnicity in crime data, we opted to develop a model devoid of ethnic or racial identifiers.
Initial monitoring of this Universal model's performance has been promising. We've benchmarked it against the 'Standard' version of our algorithm and are encouraged by the results. The underlying machine learning architecture, utilising the XGBoost model, remains consistent with our original academic publication.
–
Another update is for rural areas - we have opted out from using amenities data from OpenStreetMap because of unequal distribution of missing data - due to the collaborative nature of OSM which could distort our predictions in rural areas, where such data tends to be scarce. This change has increased our performance in less densely populated areas.
As usual, our data sources were refreshed to reflect the most up-to-date information, while granting a great deal of attention to quality issues. This time, we use predictors and crime incidents from the 2017-2021 time-period to train the model, in accordance with the availability of ACS 5-year estimates. The influence of Covid is therefore taken into account to its full extent this year.
Model performance and validation
We benchmarked our model against state-level crime statistics provided by the FBI's NIBRS program. The alignment between our predicted figures and the NIBRS data is quite strong, with a 95.5% correlation for violent crimes and 92.8% for property crimes in our standard model. In the universal model, the correlation rates are 95.5% and 92.7%, respectively. However, it's important to remember that correlation isn't enough to measure accuracy. The following is a breakdown of violent crime comparisons across all states where NIBRS data is sufficiently reliable, based on the level of participation from local law enforcement agencies:
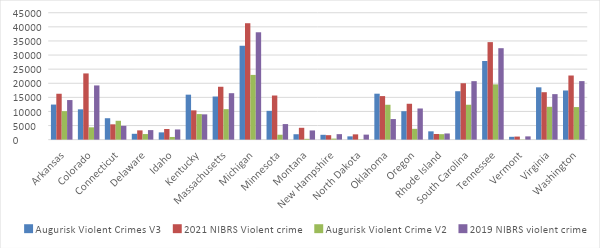
The new Universal model shows a good performance against NIBRS data, and its performance indicators in our test data are slightly below the standard model, as shown by the mean absolute errors (MAE). The difference is, however, not significant:
Conclusion
The third iteration of our crime model uses newer data, refines its use of predictors, while maintaining a strong performance. Remarkably, our updated universal algorithm, which excludes the use of any ethnicity or racial background variables, outperforms the conventional model in the majority of states when evaluated for out-of-sample reliability using NIBRS data as a benchmark.
Simon de Bonviller
Lead scientist @ Augurisk