Why adequate crime risk data is important for property buyers and renters
The value of crime risk data to assess neighborhood safety when choosing your property should not be underestimated. Our experts explain how to get a comprehensive crime risk assessment for any location in the US.


Major real estate companies have recently announced their intention to withdraw crime maps from their websites. Behind this decision, Realtor.com and Redfin described several reasons, sparking an important debate about the advantages and disadvantages of using crime data when choosing a property to buy or rent.
At Augurisk, we see this discussion with satisfaction, as the limitations of existing crime data are precisely what led us to create our crime risk assessment. This article is our contribution to this debate, hoping it could enhance our understanding of crime data’s strengths and liabilities.
Is crime risk underestimated in the current FBI UCR crime data?
One of the reasons behind Realtor.com and Redfin’s choice refers to the difference between crime as it occurs in the street, and the crime statistics recorded by law enforcement agencies, to be centralized afterwards through the FBI Uniform Crime Report program. If a crime occurs but is not recorded (because, for example, victims don’t go to the police), then crime statistics underestimate the crime risk.
How can we check that? One way is to look at the difference between FBI crime data and estimates of victimization. There are two sources of crime data classically used to describe safety: first, data from the FBI’s Uniform Crime Report program provides information on how many crimes were recorded by the police in an area. The UCR program centralizes data from as many local law enforcement agencies as possible. However, not all agencies forward their data, and for some types of crimes, it might be that crimes are not declared to the police, and crime is then underestimated. Another source of data is the Bureau of Justice, which provides statistics using victimization surveys. In short, they ask a number of people representative of the U.S. population whether they have been the victim of a crime over a certain time. They then derive trends about crime.

In 2019, for example, 448,783 violent crime incidents (excluding simple assaults) were recorded by the FBI’s NIBRS program, covering about 47% of the population. If we hypothesize that those 47% are representative of the total population, we get about 954,857 violent crime incidents, involving an unknown number of victims (superior to that).
According to the US Victimization Survey, there were about 1,200,000 victims of violent crime in 2019. This would suggest a 20.5% underestimation, under the hypothesis that each crime incident generated one victim. This might appear high, but a slight modification in this hypothesis can have important effects: for example, if each crime makes 1.1 victims (that is, one in ten crimes has two victims instead of one), then the underestimation is only 12.5%. Besides, the BJS does not include victims under 12.
Besides, other types of crime are likely to be better reported: take motor vehicle theft, for example. To be reimbursed by their insurance companies, victims of a theft often have to declare it to the police. The result is that the NIBRS program recorded 314,929 incidents in 2019. Those would represent about 670,000 crimes if we consider that NIBRS only covers 47% of the population, while in fact, the BJS Survey suggested 495,670 victims for the same year!
Keep in mind, however, that FBI data and BJS data are not always comparable. Some crime types (for example, murders) cannot be described by the BJS. Besides, crime categories are sometimes different, and victimization surveys focus only on citizens aged 2 or older. Finally, although the population sample is representative, the BJS cannot afford to question the entire population, which brings additional uncertainty.
Is there a racist bias in the way crime data can be used?
Crime is caused by numerous factors, some of them are known (poverty, income disparities, social ties, population density, or even climate), and others remain unknown. Among the known factors are socioeconomic characteristics (such as the poverty rate), which can disproportionately affect some communities based on their ethnic or racial background. Thus, crime rates can coincide with certain communities. However, correlation should not be confused with causality: the factor causing crime in our example is the poverty rate, not race or ethnicity. It could make sense to provide people with contextual elements of crime to avoid confusion.
In this sense, crime data could be misinterpreted and strengthen racial biases if people relate crime to race or ethnicity. However, not using crime data can lead to even more severe mistakes, as there is a difference between crime risk, as it is perceived by people, and crime, as it occurs statistically speaking. Risk is always part of our lives, and factors commonly perceived as indicators of safety are sometimes misleading.
In this perspective, we believe that crime data should be used as one element to assess neighborhood safety. It should, however, be complemented with neighborhood feedback and contextual elements to help the user understand what the data means and doesn’t mean, especially when it comes to racial bias and disparities in access to housing.

What parameters reflect actual neighborhood safety?
Neighborhood safety can be described in many ways. In our case, let us consider safety as a low probability of being affected by a crime (the lower, the better).
A few parameters can be used to describe neighborhood safety. Each explains a different part of the story. For example, crime counts (e.g. there have been 10 violent crimes in your block in the past 10 years) inform you about how often crimes occur in the area, whether you are affected or not.
Crime rates relate the number of crimes that occurred to another variable, such as population. For example, there have been 200 crimes per 100,000 residents in your neighborhood over the past 10 years. This indicator is used more often, as it describes your safety in a closer way: if 10 crimes occur in your block, it is not the same if 10 or 1000 persons live in your block. In the first case (10 persons), it can be argued that you will be affected by one crime on average, while in the second case you have a 1% probability of being affected by a crime.
Finally, other factors can be used as proxies - that is, statistical shortcuts that could indicate a lower crime risk. Earlier this year, the home security company Vivint asked 1,000 people how they defined neighborhood safety. Factors such as seeing children playing outside, walkers or runners, and a visible presence of neighbors were frequently cited.
Of course, no indicator is perfect: crime counts do not take population into account and thus the probability to be affected; the crime rate itself can only take into account residents, and some places (for example, parks) can be populated at certain times without anyone actually residing in such a place. In this case, crime rates do not bring much in describing your actual safety.
Finally, other perceived factors (e.g. children playing outside) are perception based, which can be tricky: for example, it has been argued that less children played outside around 2004 than in their parents' generation (see, for example, Clements, 2004). The reasons found were increased time spent in front of screens, but also crime concerns among mothers. But then, if parents don’t let their children out for crime concerns, and then their absence is interpreted as a sign of crime risk, we are at risk of a ‘self-fulfilling prophecy’.
Generally speaking, it is therefore ‘safer’ to consider that each indicat or tells one part of the story.
How does Augurisk increase crime data quality and availability?
At Augurisk, we can only agree with Realtor.com and Redfin on the limitations of crime data.
To address these limitations, we created our crime risk assessment with a few improvements over traditional crime data:
Limitation 1. Data from different law enforcement agencies is not always comparable.
Solution: Our algorithm produces predictions with common crime category standards, making them comparable across the entire contiguous USA.
Limitation 2. Not all law enforcement agencies submit their crime statistics to the FBI, so no data is available in some places.
Solution: Our predictions are generated based on about 200 predictors available everywhere in the United States. Augurisk crime data is thus available everywhere in the country.
Limitation 3. The highest resolution available through the UCR program (law enforcement agency) is limited.
Solution: Augurisk provides predictions down to the Census Block Group resolution. That is more precise than Zip code.
Limitation 4. The reported crime data can be of unequal quality, depending on the place and budget of a given law enforcement agency.
Solution: We train our algorithm on 15 of the biggest cities in the U.S., where a priority is given to data, as proven by their commitment to open data and producing detailed, latitude/longitude/type of crime datasets.
How to check the crime risk of any property in the United States
- Login or sign up to the Augurisk platform.
- Press Add New Project
- Fill in the address
- Generate a Risk Audit
- Select Crime Rate among the Societal Risks
- View your Crime Risk Index and statistics on yearly predicted crimes occurring in your Census Block Group.

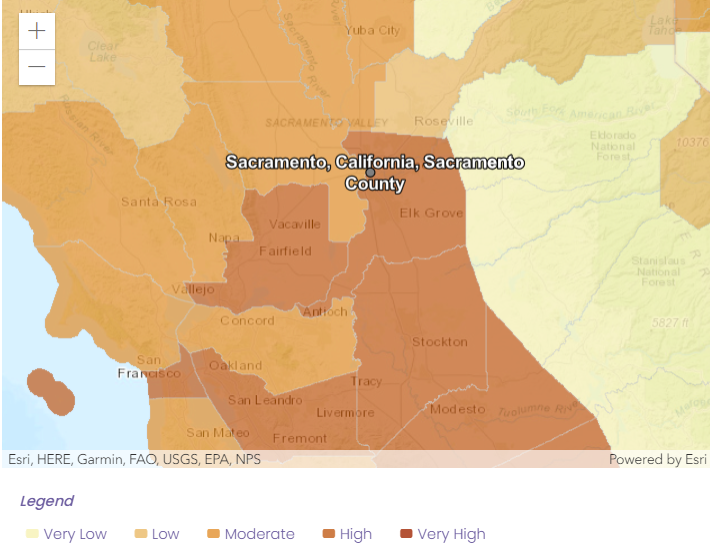
Caption: Average yearly number of crimes predicted by Augurisk algorithm. The crime score takes into account the number and severity of crimes, as well as the population density of your block group.
- Receive a detailed crime risk assessment for your Block Group, including the Average Crime Risk by County
Have some questions? Contact Augurisk.