New drought risk assessment with Augurisk
Augurisk just released a new drought assessment, now available throughout the Augurisk platform.

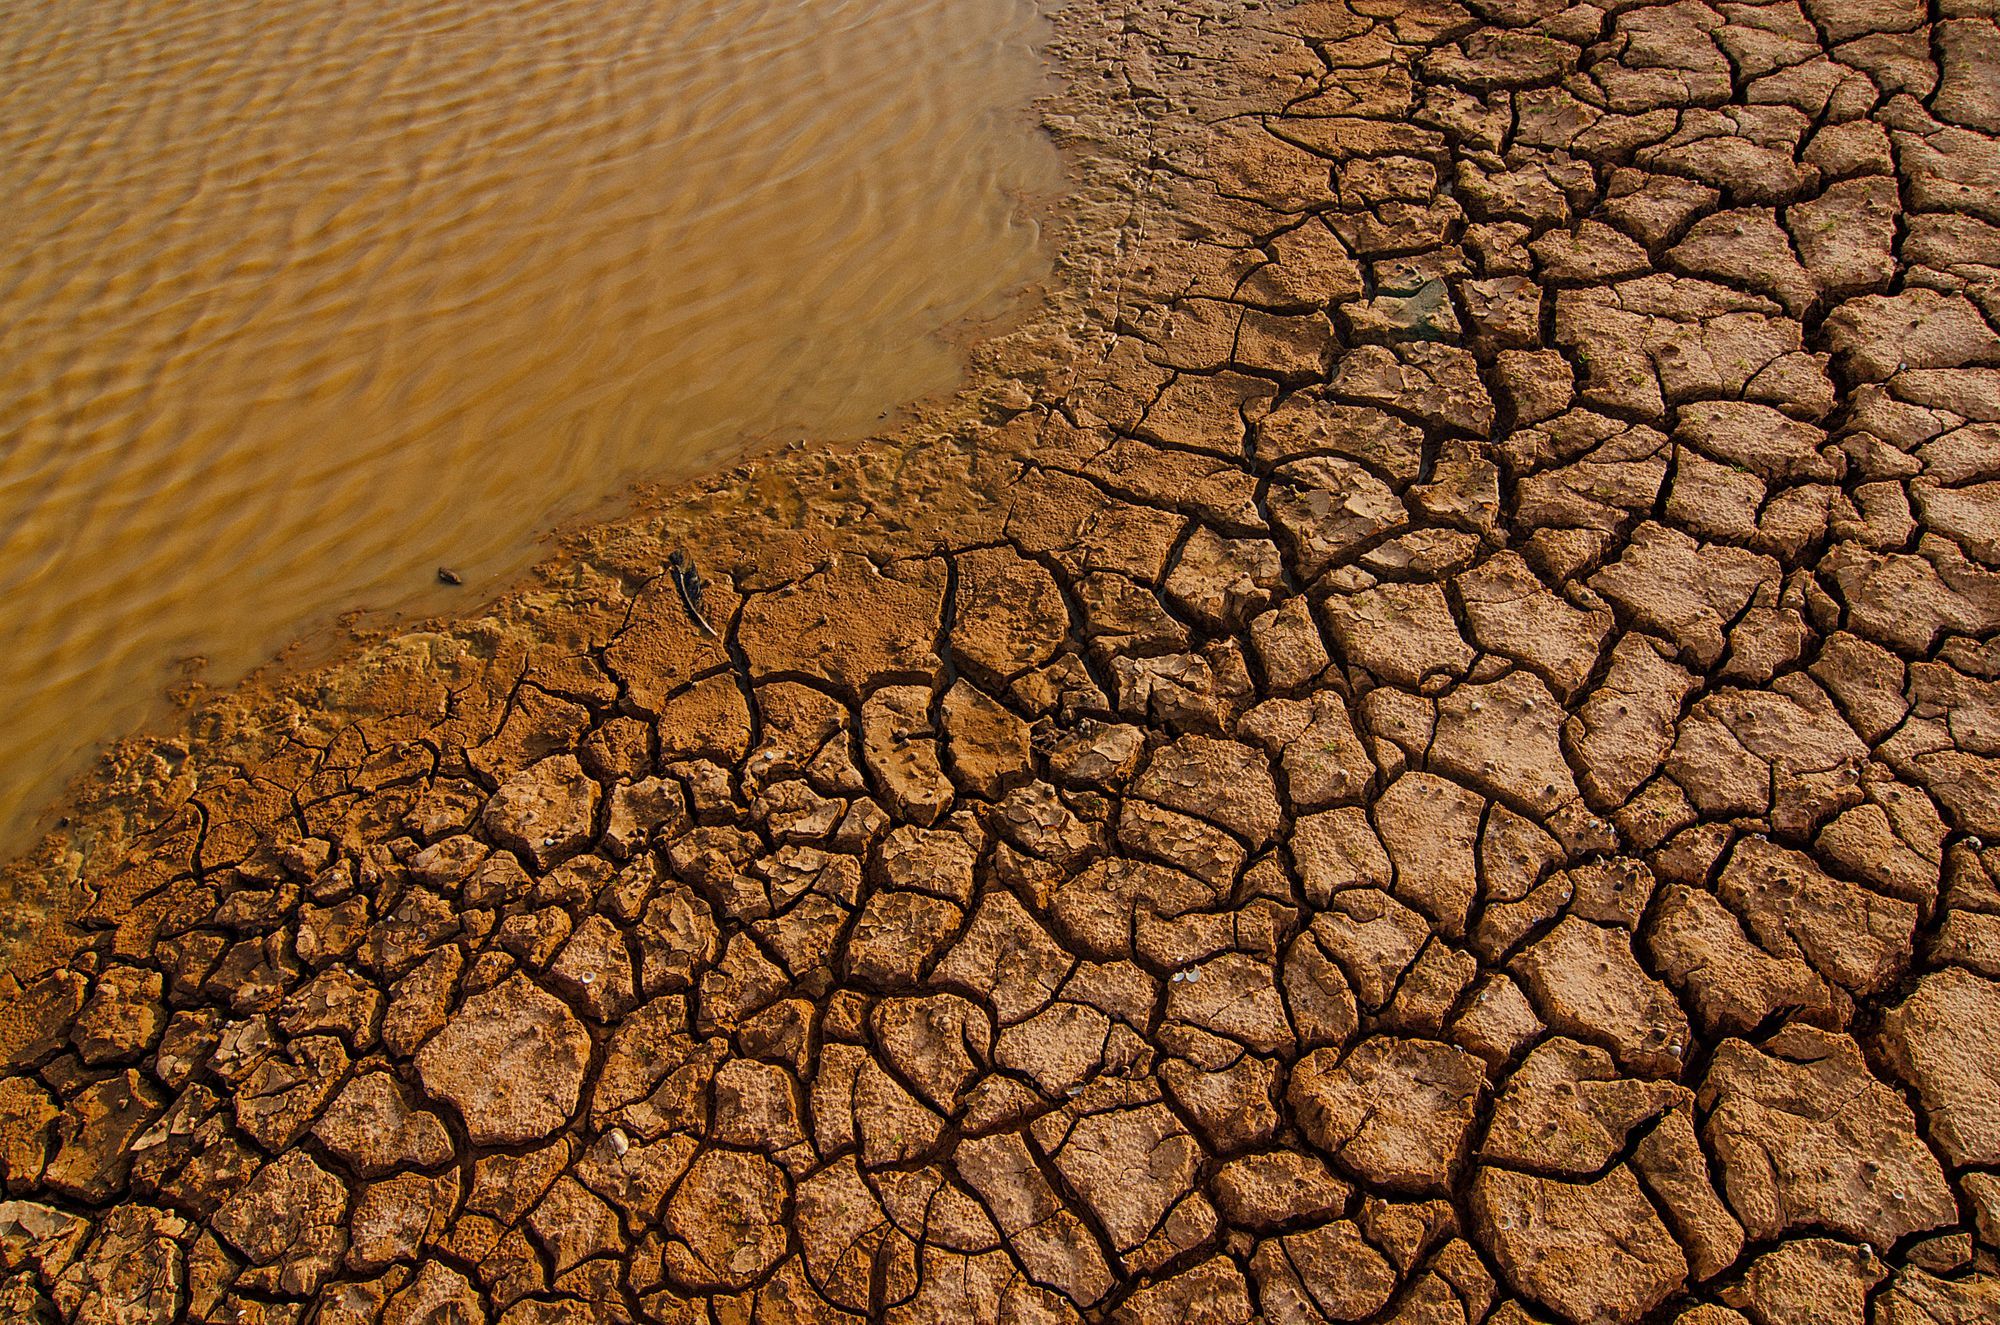
Last July, a major heat wave hit the Pacific Northwest, and summer temperatures became a concern once again. Besides melting roads and power cables, the heat can have a longer, worrying effect on water resources, society and the environment: drought.
Broadly speaking, drought refers to a situation of abnormal dryness. It can have a wide range of negative effects, from temporary restrictions by the authorities (no garden watering, no swimming pools) to serious economic losses (notably, in the agricultural sector) due to water scarcity. Not to mention its environmental consequences.
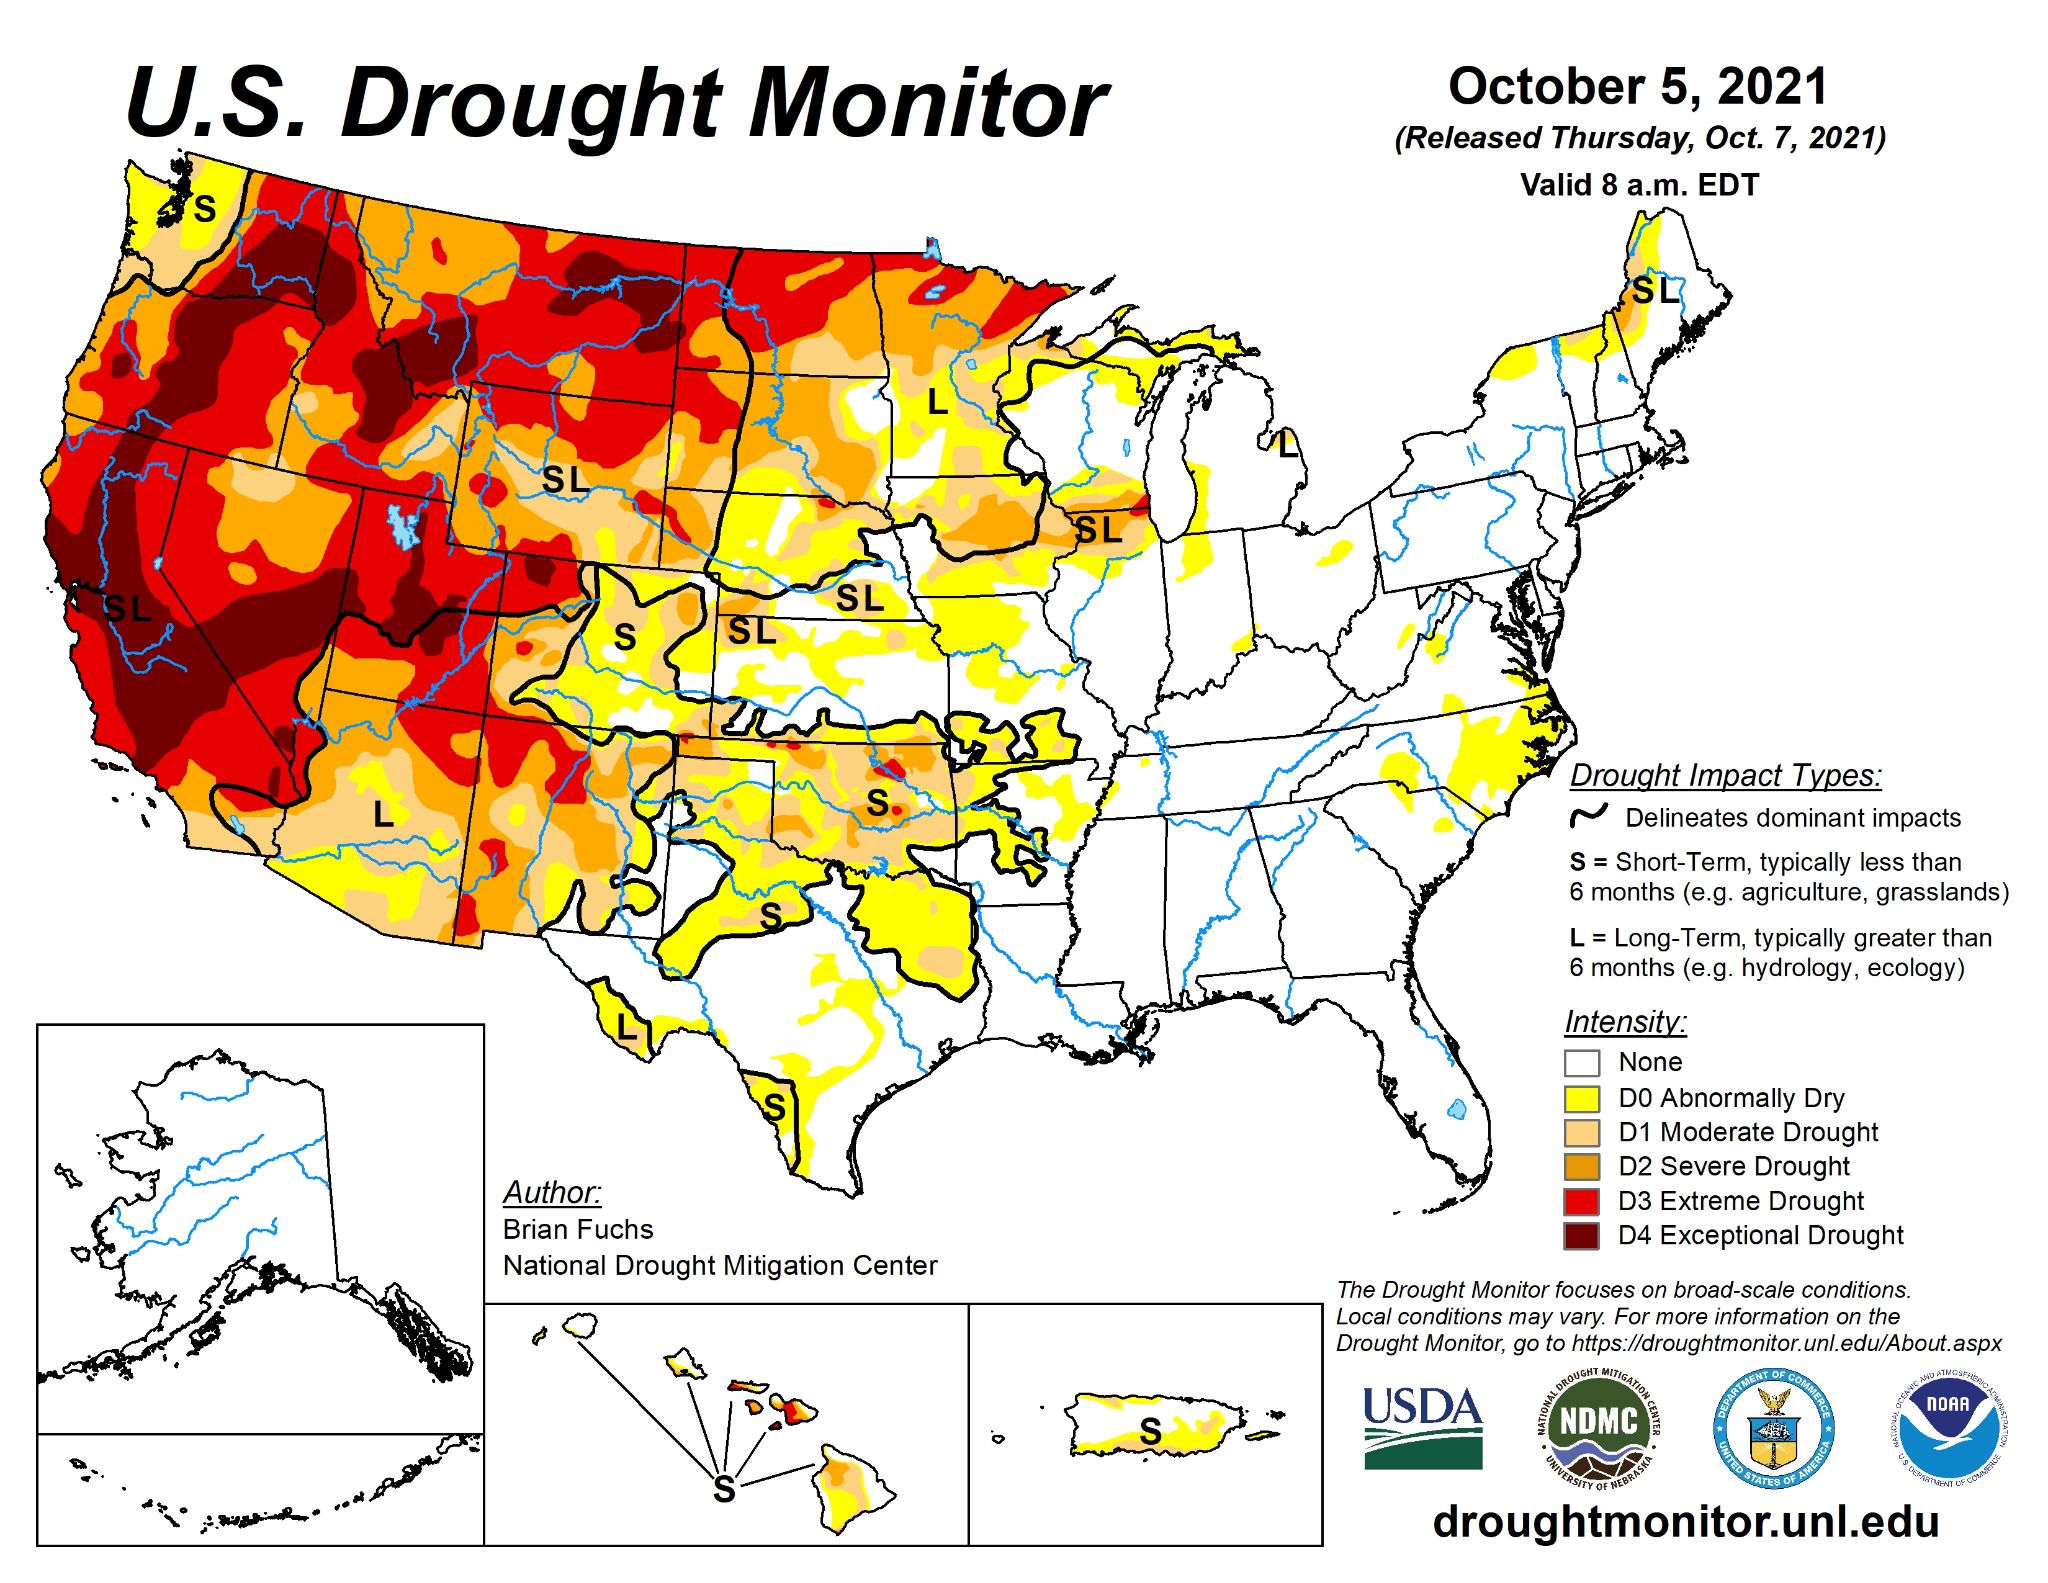
Right now, a significant part of the West is under exceptional drought conditions, as measured by the U.S. Drought Monitor:
Why should you care?
Drought risk is important: water is essential to numerous sectors. Restricted access to water can, for example, affect the construction industry, the agricultural sector, and bring property prices down. Moreover, drought crosses other risks already estimated by Augurisk. Dryer conditions enhance the potential for wildfires, and a lasting drought can endanger the socioeconomic livelihood in rural communities.
Drought risk can affect a broad number of people, including corn growers, restaurant owners, or property owners.
Drought risk assessment with Augurisk
The drought risk score is now available on Augurisk. If you already own a project, you will see a new tab for Drought. The assessment is based on weekly drought data from the U.S. Drought Monitor for 19 years (2000-2018). The risk index at your location (as always, between 0 and 100) is based on the past frequency and intensity of drought episodes in your area:

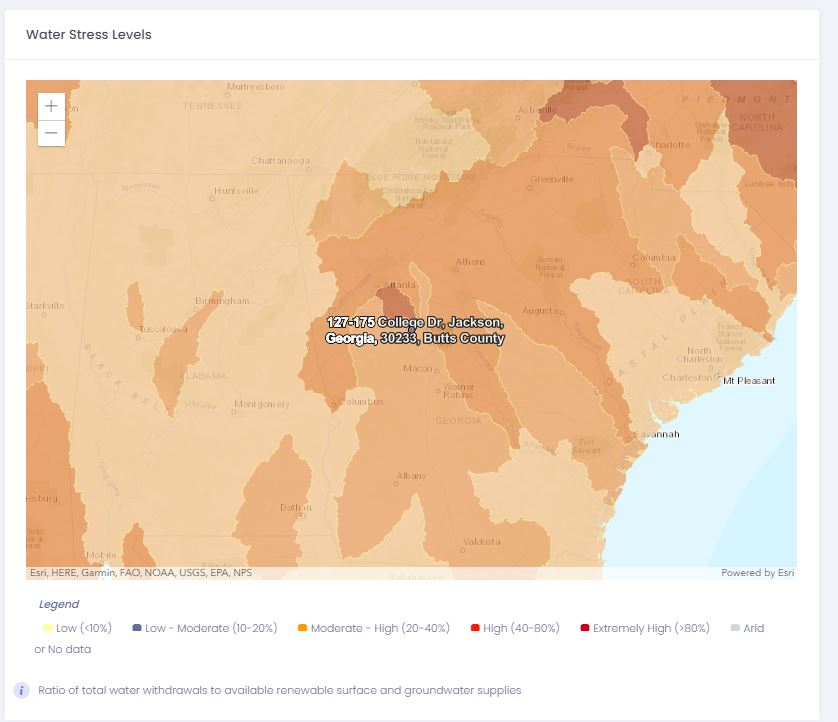
We also provide additional contextual data, including a map that displays water stress at the project location as measured by the World Resources Institute:
A visualization showing cumulative drought index (CDI) values in the last years is also available to help you understand your score:
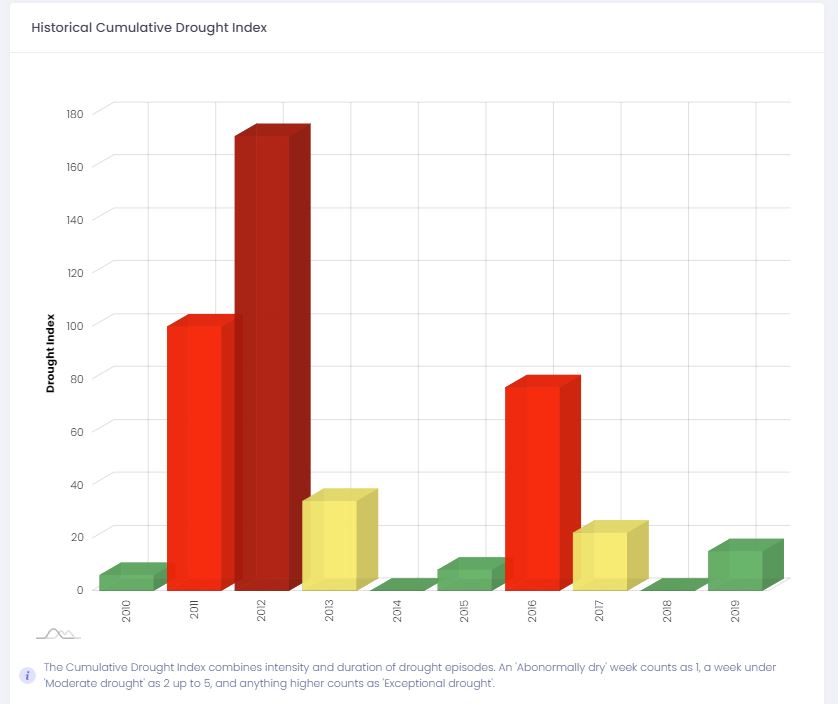
CDI is a measure of how frequent and intense drought has been in a given time period. The annual estimates count the number of weeks during which a place has been affected by drought, and affect coefficients to each episode based on its intensity: an abnormally dry week (denoted by D0 by the US Drought Monitor) counts as 1, while an Exceptional drought (D5) counts as 6. In the location described above, drought episodes have been frequent and intense in 2011 and 2012, when the CDI reached 172. Considering 52 weeks a year, it means that each week of the year involved a severe drought (D2) on average. It reached a problematic level again in 2016, when the CDI was 77: in that year, a week was abnormally dry (D0) on average. Fortunately, water has returned since then, as CDIs came down in the following years.
To try out the new Drought risk assessment, login to your Augurisk account or click here to sign up for free.
Got questions? Remarks? Feedback? Reach out to contact@augurisk.com and we would be happy to help.