Get ready for storms: update on your storm event risk scores
Augurisk has released a new update to the storm event assessment with additional tools to analyze your exposure.

Americans can now use a new tool to estimate the risks of storm damage to their properties. Our recent update to the Augurisk storm event assessment offers additional functions, like restricting data to more (or less) intense storms, depending on your vulnerability. For some properties, risk scores could evolve significantly due to these changes.
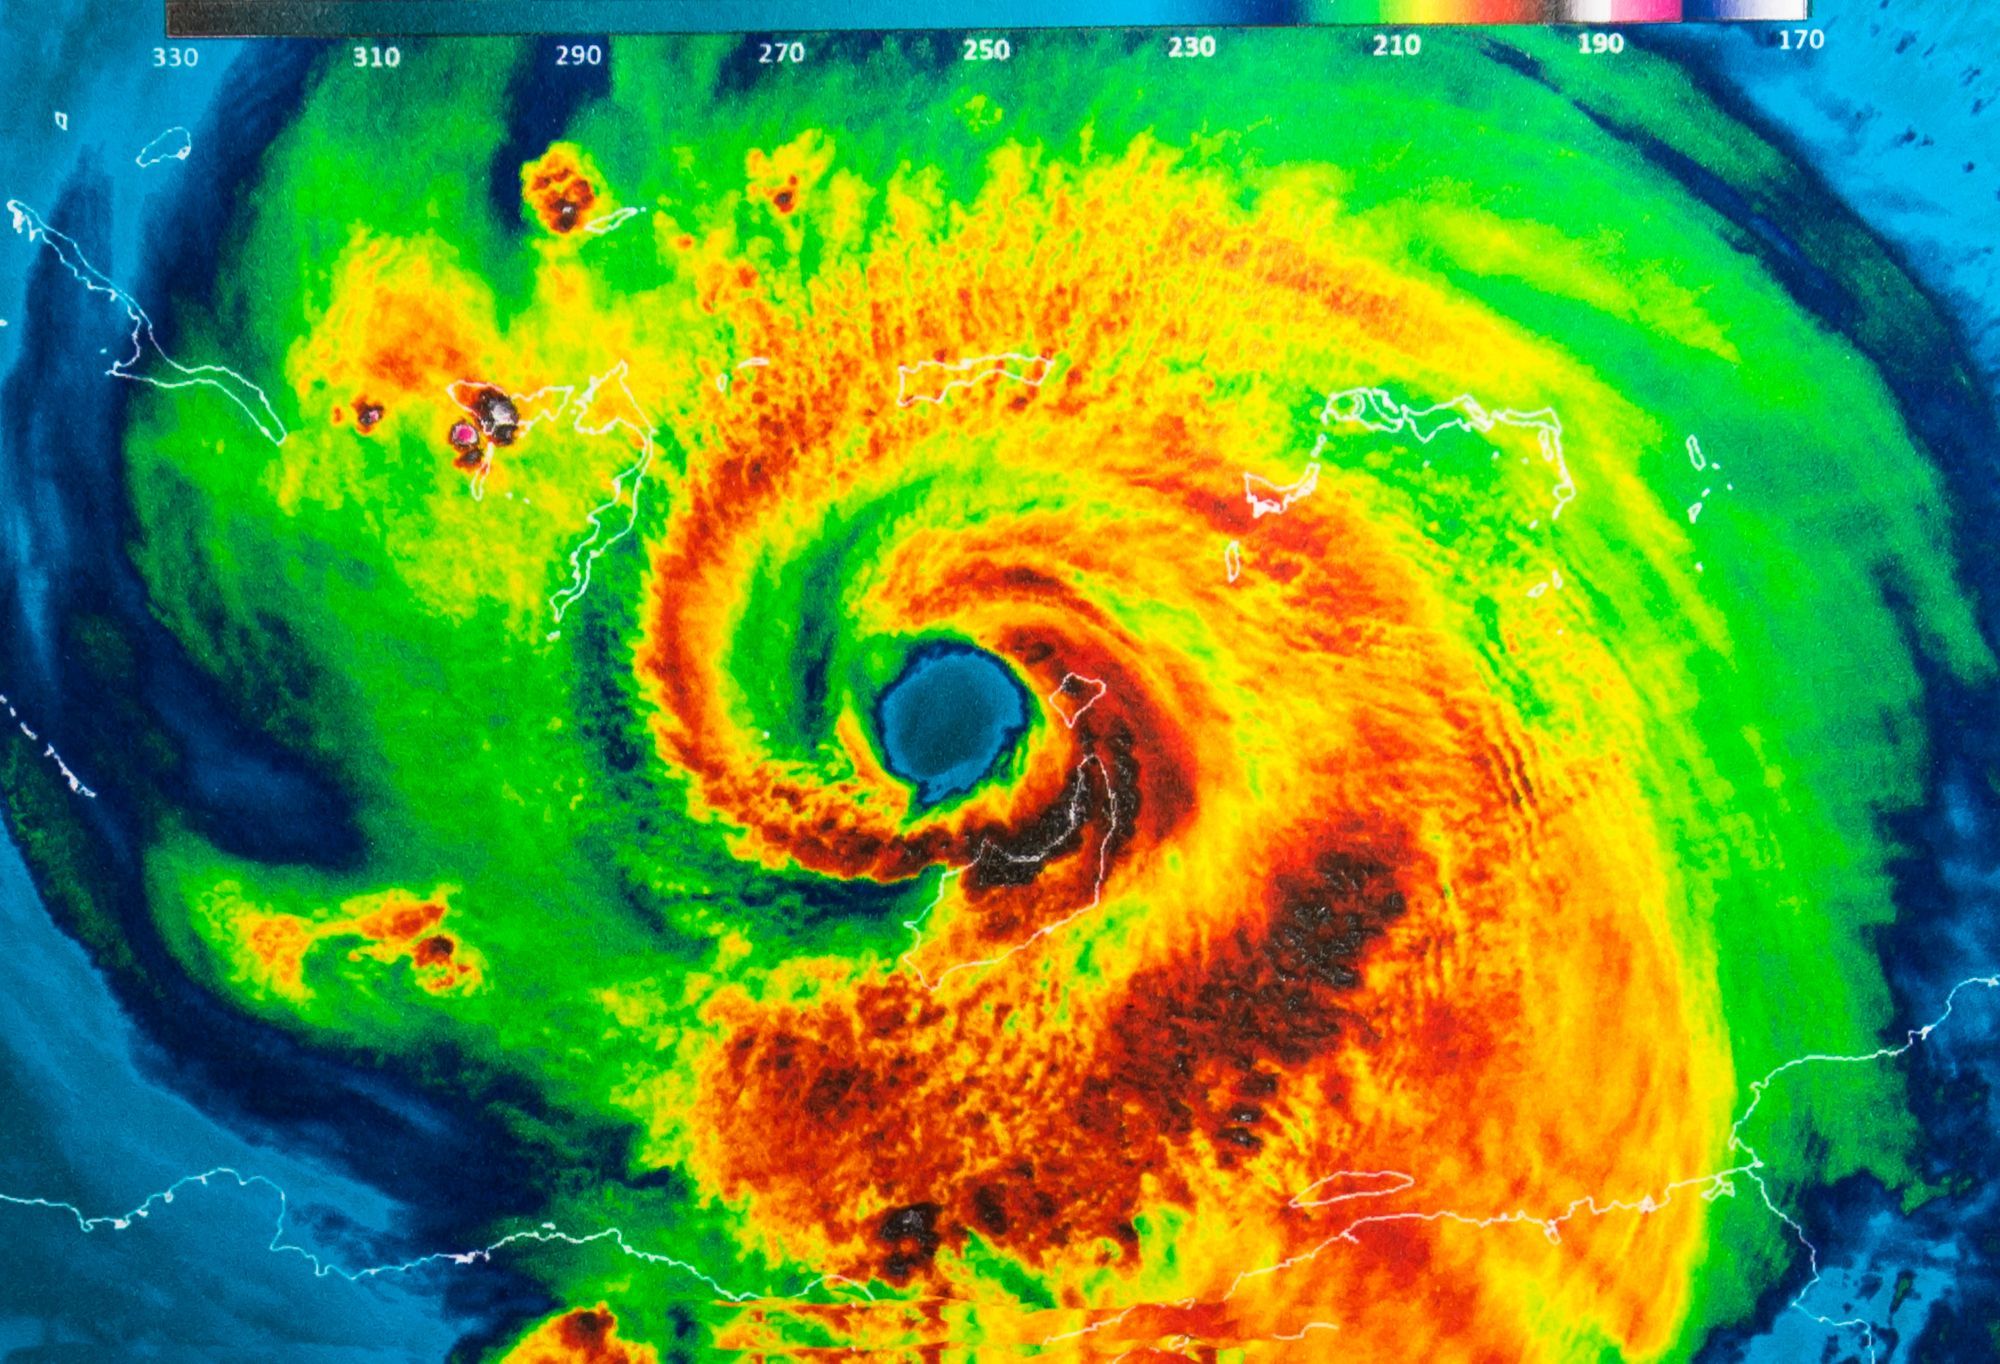
Hurricanes
The 2020 hurricane season in the North Atlantic ocean has been especially intense, with 30 named storms, 12 of which made landfall in the contiguous U.S. 2020 was the most intense hurricane season on record, generating $47 billion in damage. The 2021 season has already produced 21 named storms, making it the third most active Atlantic hurricane season.
Interesting fact: 9 of the 10 costliest hurricane seasons have occurred since 2004, which stresses the importance of keeping up-to-date assessments.
Our new hurricane assessment is based on all types of storm events that have crossed your block group since 2004. That includes tropical, subtropical, and extratropical storms, and hurricanes.
The area covered by each event in a given day has been generated as GIS data using past hurricane tracks from the HURDAT2 project. Here is how Hurricane Sandy (2012) looks at this stage: each brown polygon represents the area affected by winds over a given threshold (such as 34 knots, for example) in a given day.
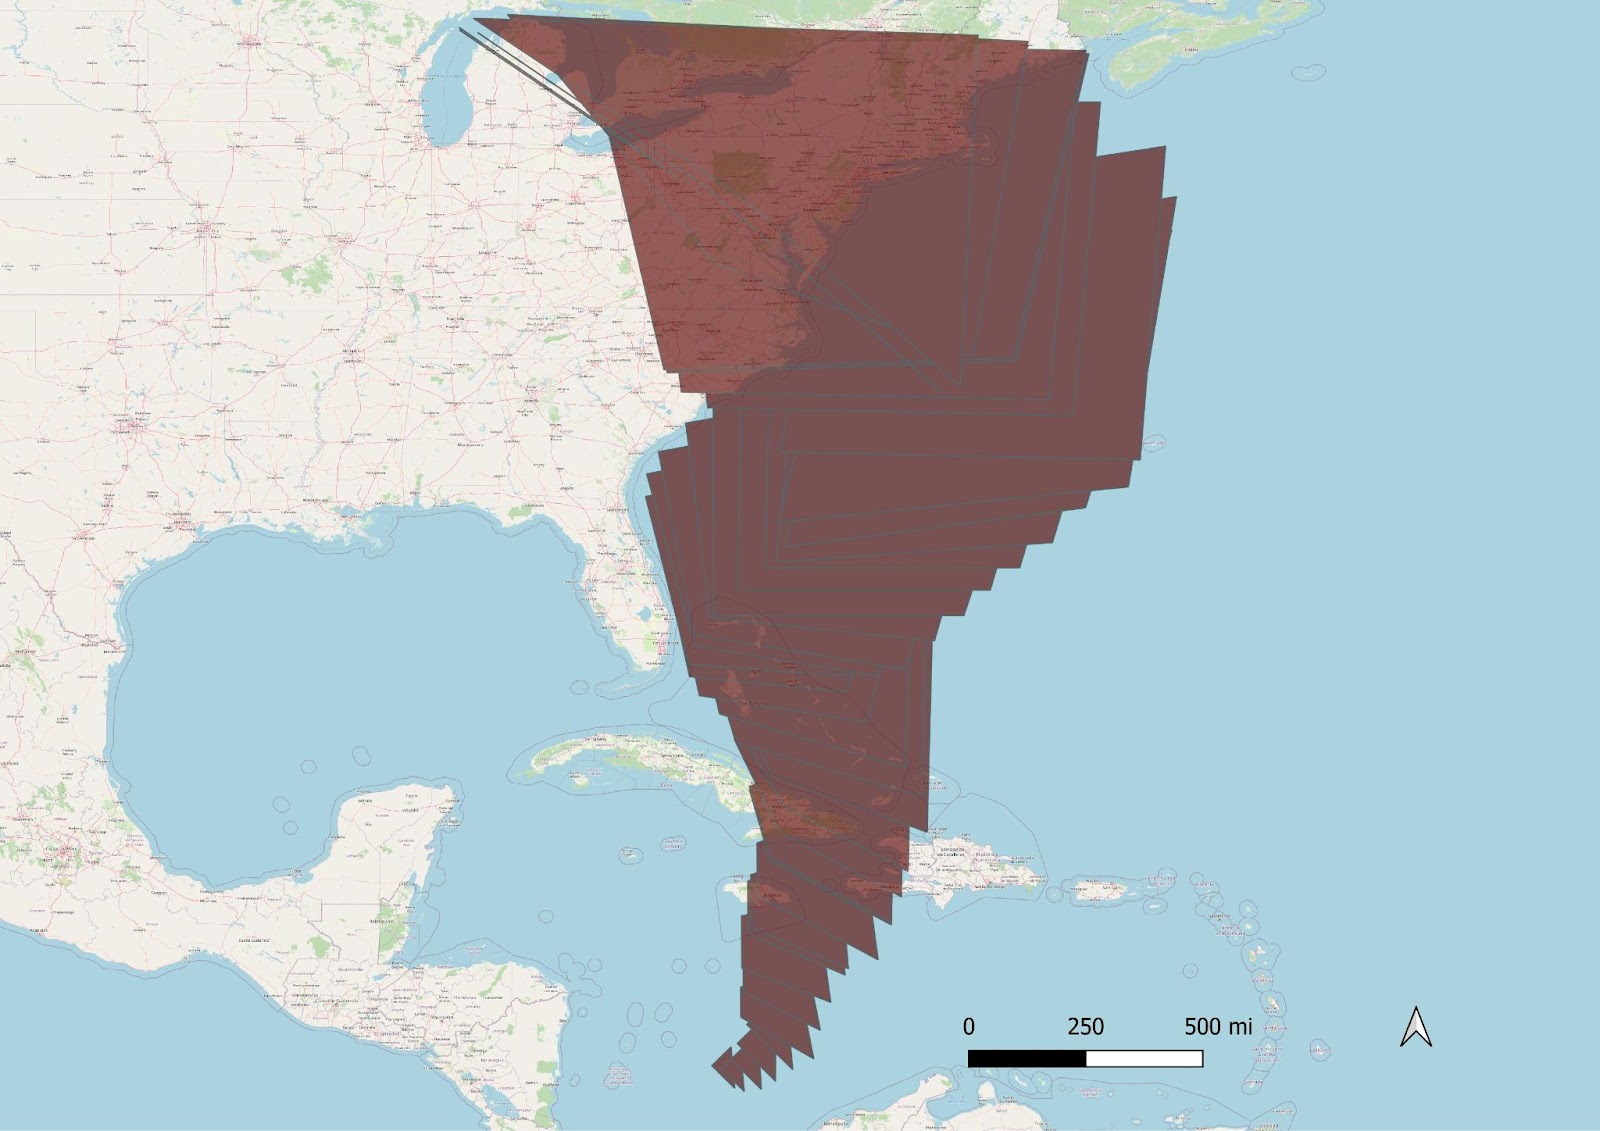
Representation of the areas hit by hurricane Sandy, day by day. Source: Adapted from HURDAT2 data.
The data was crossed with the geography of the U.S. Block Groups and Counties. We provide a list of all events which already hit your area, along with their respective names, wind intensity, etc. As always, we also generate a 0-100 storm hazard score, with 100 being the highest possible hazard level.
If you are not interested in less intense events, such as tropical storms, where winds are slower than 64 knots, we added an option to select the type of events you want to be included in your assessment. Hurricanes, for example, are events whose wind speed is over 64 knots (about 74 mph), tropical storms involve winds between 34 and 64 knots. If you’re interested in only including hurricanes or storms, select the respective option in the scale element:

Example of assessment focusing exclusively on hurricanes. The number appearing at the center and the displayed risk score only include events implying hurricane-force winds in this configuration.
Snowstorms
In February 2021, a major winter storm hit Texas. At least 57 people died, and major disturbances were caused to the power grid. This event was a terrible example of how hazard (the probability that a winter storm will occur), exposure (if it occurs, will it affect your area?) and vulnerability (if it occurs AND you are affected, how prepared or vulnerable are you to this storm?) combine to form what we call risk. Vulnerability, here, was the key factor, as people and infrastructures were not prepared for a major winter storm.
Our new snowstorm assessment is mostly based on 100 years of data from the snowstorm database. We measured the number and intensity of snowstorms affecting your location to generate our scores and data.
By default, we assess the Snowstorm vulnerability based on local thresholds triggering snow warnings at the nearest Weather Bureau Office. Risk scores are based on the number of days where snowfall exceeded the local threshold in the past. However, if a property is located in a county where low elevation and high elevation areas coexist, it is possible to customize risk assessment parameters: are you concerned about days where snowfall exceeds 4 inches? 8 inches? 12 inches? Pick your preference, and the data and risk score will be updated accordingly:
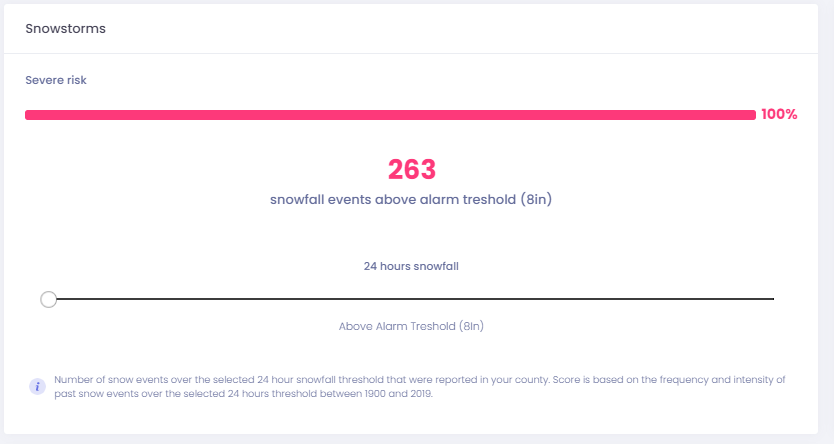
Example of a snowstorm risk assessment using the Augurisk alarm threshold. In this configuration, only snow events involving more than 8 inches of snow in 24h are included in the number at the center and in the scoring methodology.
Hail Storms
Hail is a risk well-known by the insurance industry, and in some areas of the world hail data is precious enough to be kept jealously on private servers. Fortunately, in the U.S., NOAA’s Storm Prediction Center provides historical hail data for about 60 years (1955-2018).
Here again, our risk scores are based on the frequency of past events and their intensity. By default, we include all events in the assessment - even those where hail size is less than a mothball. Usually, hail is considered severe by NOAA’s National Severe Storms Laboratory when over 1 inch (a quarter). You can choose what parameters you want to include: All events, only hail events with a hail size superior to 0.5 inch (about a mothball), 0.75 inch (about a penny), 1 inch (about a quarter), or 1.5 inch (about a ping-pong ball).
The risk score and data will be refreshed accordingly:
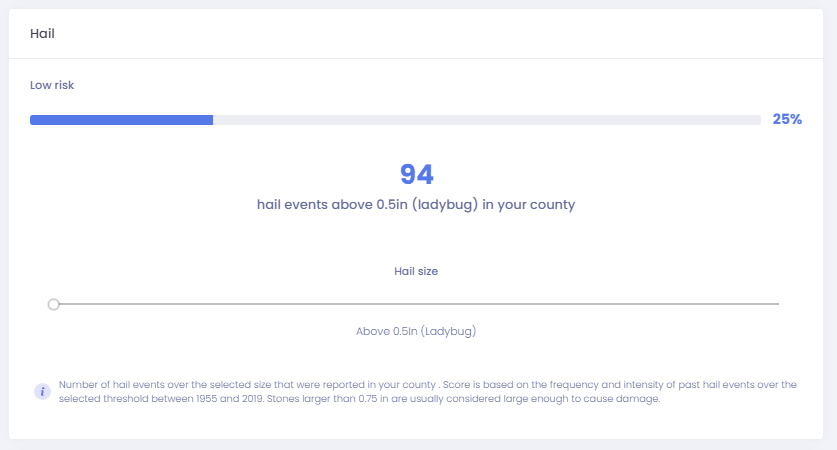
Example of a hail risk assessment. In this configuration, only events involving a hail size over 0.5 inch (about the size of a ladybug) are taken into account in the number displayed at the center and the risk score on the top right.
Tornadoes
Preliminary data for 2020 suggests that 1,053 tornadoes were reported between January and December in the US, a number slightly lower than the 1991-2010 average (1,251). Notably, an outbreak of F3 and F4 tornadoes caused havoc around Nashville, Tennessee, forming a billion-dollar disaster, as defined by NOAA’s National Center for Environmental Information (NCEI).
The Tornado risk score has been updated using refreshed data from NOAA’s Storm Prediction Center, and new functionalities were added. Each project now has access to detailed data about the number of past tornadoes recorded in the county, by Fujita-scale intensity. Risk scores can also be personalized: users can now exclude some tornadoes of weaker intensity (such as F0 or F1), or restrict the analysis to the strongest tornadoes (F5):
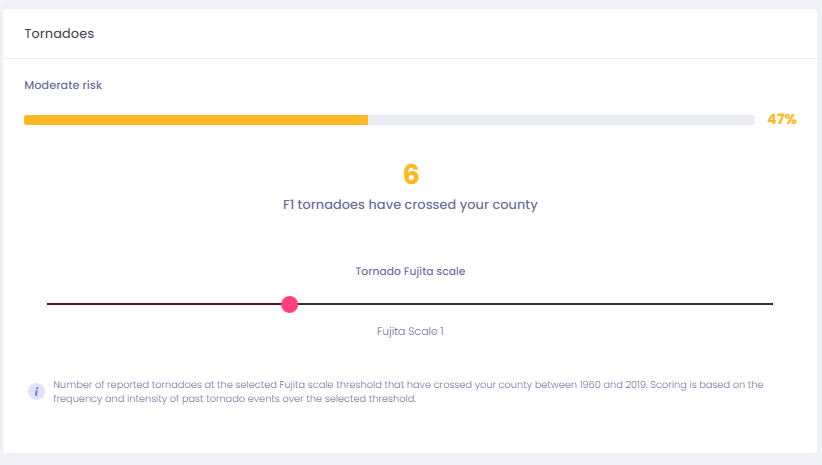
Visualization of the tornado risk assessment, displaying the number of F1 tornadoes having crossed a county and the risk score based on all F1+ tornadoes.
Storm events global scores
In addition to our assessments covering specific events, we designed a risk score summarizing your exposure to all storm events covered:

Example of a global storm events risk assessment.
This index is a weighted average of your Hurricane, Snowstorm, Hail, Blizzard and Tornadoes risk scores. Events that generate more economic damage each year, such as hurricanes, have been attributed a bigger influence on this score to reflect their potential impact. It uses default risk scores for each subtype of events. For example, all events are included in the hurricane assessment, and the tornadoes assessment includes all tornadoes, from F0 upwards. Keep in mind the global storm index is an average: each individual assessment at the basis of this average also provides fundamental information regarding your risk exposure.
Login here or sign up for free here and try the new storm risk assessment by generating a project for any address in the United States.
As always, we are open to feedback regarding our update. Happy? Not happy? Tell us here!