The Cost of Natural Disasters for Insurance Companies
Insurance companies in the US lose billions of dollars each year due to natural disasters. Our new analysis explains how to assess risks from various disasters and improve the resilience of businesses, households, and communities.

In addition to the severe disruption caused by the pandemic, millions of people are exposed to severe natural disasters. In 2020, the global economic losses from natural and man-made disasters are estimated at USD 202 billion, compared to USD 150 billion in 2019. The US has been heavily hit, with hurricanes battering the East Coast, massive wildfires across the west, and record numbers of convective storms in the Midwest.
The insurance sector has covered USD 89 billion of the economic losses in 2020 due to disaster events, with USD 81 billion resulting from natural catastrophes, according to Swiss Re Institute. The biggest insured loss events in the US were hurricanes Laura and Sally, and a “derecho” storm. Other losses came from multiple small and mid-size secondary peril events, including severe convective storms (SCS) and wildfires, with colossal destruction in California.
The increase in economic losses is driven by the accelerating severity of weather events, associated with climate change, population growth, and increasing property values in the exposed areas. Although the landfalls from the North Atlantic hurricane season last year mostly hit areas not densely populated, they may also strike areas with more concentrated wealth. This could further increase economic losses and insurance compensations.
In this paper, we will discuss the crucial aspects of natural disasters and special tools available for disaster risk assessment of properties. This approach can help insurance companies optimize their risks associated with natural catastrophes, and improve the disaster resilience of businesses, households, and communities.
Primary perils
Primary perils refer to large scale catastrophes, including tropical cyclones, earthquakes and winter storms. These events are not frequent, but can lead to extreme economic losses.
The consequences of such events can trigger heavy rainfalls during a tropical cyclone, fires from earthquakes, or storm surges resulting from winter storms. These are considered secondary effects of primary perils. For the insurance industry, the rise of their associated losses is significant, but these risks are often not fully monitored or modeled during risk assessments.
Secondary perils
Secondary perils include severe convective storms (SCS), like thunderstorms, tornadoes and hail storms, flash floods, landslides, wildfires, drought, and snow storms. These weather events generate losses on a low and medium scale, but can happen more frequently.
The total costs of secondary perils in 2020 totaled over USD 57 billion (71% of the total losses from disasters). The main drivers in the US were 40 separate SCS, which generated accumulated insured losses of over USD 30 billion, and wildfires. Hence, 2020 was the fifth-costliest year on record for insurance companies.
How weather risks increase the insurance costs
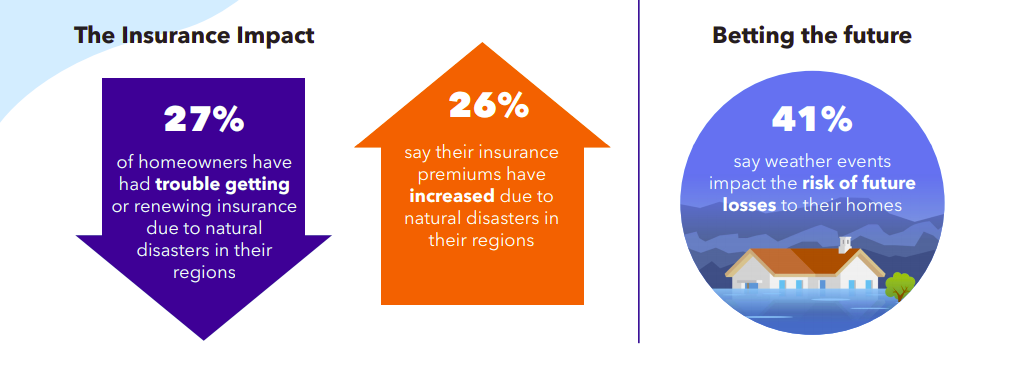
A recent survey by the National Association of Insurance Commissioners (NAIC) showed that over a quarter of property owners had difficulties getting homeowners insurance or renewing their policies due to natural disasters in their area. 26% of homeowners reported their insurance premiums have increased due to the rise in natural disasters.
Disaster risk modeling
While the insurance industry has strong capabilities to model and monitor the risks from primary perils, there is insufficient adequate modeling and monitoring of the secondary effects of primary perils and the risks from secondary perils.
These trends observed in 2021 will put significant additional pressure on insurance rates for 2022:
- The combined losses from natural disasters in 2021 from wildfires, winter storms, and hurricanes are expected to reach above annual averages.
- The U.S. inflation is predicted to hit 4% - 6% for 2021, the highest in 10 years
- Industry-specific inflation is higher than the national average for labor and construction materials due to supply-chain disruptions resulting from the COVID-19 crisis.
As the economic losses from secondary peril events continue to rise, we need to use advanced modeling techniques for comprehensive risk assessment.
Wildfires
2020 was the second hottest year on record, triggering wildfires, with damage amounting to the third highest annual insured losses ever. The hottest year on record was 2016, and since then, the losses from wildfire have grown unprecedentedly - from 3% average losses to almost 25% of all secondary peril insurance losses worldwide. Before 2016, the wildfire damage had rarely exceeded 5–10%.
Most of the huge fires causing significant damage to properties over the recent years in the US have happened in California, where many areas were developed around forests. Eight of the ten costliest U.S. wildfires happened in California between 2017 and 2020. Yet, other states experience a growing threat of wildfires, where houses are built in woodland areas, especially after droughts.
According to a new AM Best report, California wildfires cost insurers more than $4 billion in commercial property losses in three of the past four years. This includes combined losses for fire, allied lines, and commercial multi-peril property coverage. Data from AM Best shows that in 2017, 2018 and 2020, direct incurred loss and related legal costs from commercial fire claims reached over $1.1 billion.
In the beginning of 2021, the California Insurance Commissioner proposed new transparency rules to provide homeowners and businesses with open access to their properties’ wildfire risk scores. Insurers will be required to provide consumers with their properties’ wildfire risk scores, indicating any mitigation actions that property owners could take to improve their rating. The aim of these regulations is to help consumers make better informed decisions when buying, selling, or building a home.
There is strong scientific evidence emerging that confirms the link between the accelerating climate change and the growing scale, length and expansion of fire seasons. Climate risks must be taken into account when assessing which areas are likely to be prone to wildfires.
Based on current weather conditions, the insured fire loss totals in 2021 may be even greater.
Augurisk has developed an online tool that assesses the wildfire hazard potential for any specific location in the US.
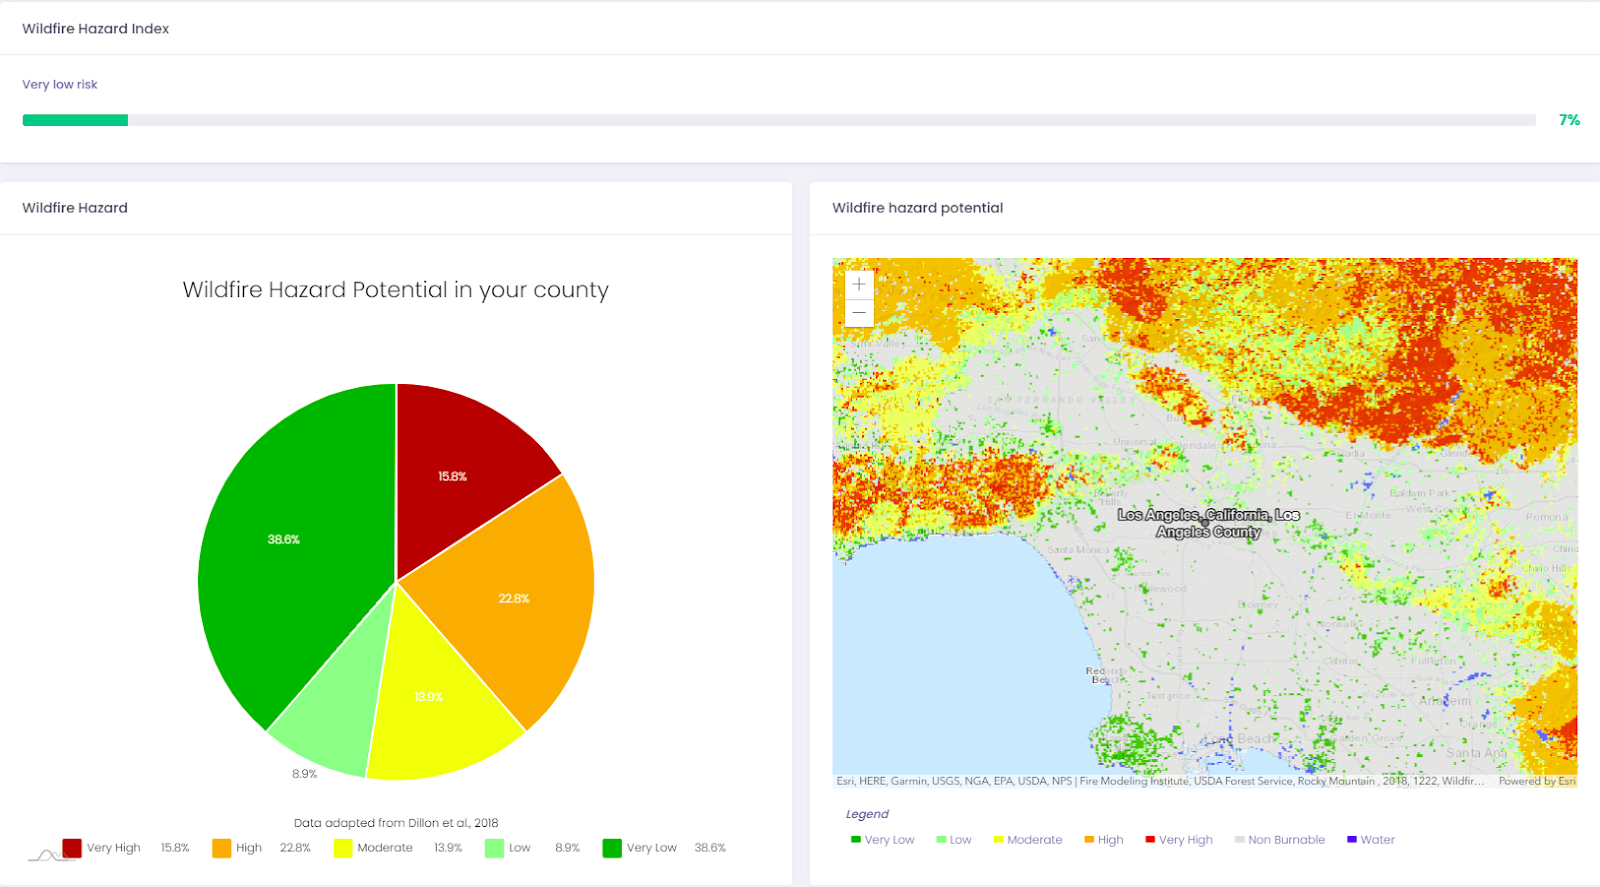
The Augurisk Wildfire Hazard index can show the level of fire danger for the location of any property. The index is based on the potential for wildfire burning in this block, and considers the impact of climate change on the potential for wildfire.
Using the Augurisk Wildfire Hazard potential map, you can get a wildfire risk assessment for any property across the US. The colors on the map indicate whether the fire risk is very low, low, moderate, high, or very high. The gray areas on the map are considered non-burnable, and the blue color is for water bodies.
The Augurisk fire risk assessment can help insurers, homeowners, and businesses better understand their risks of fire. Based on the Wildfire Hazard Score, you can develop wildfire prevention and protection measures to minimize the risk of wildfire and maximize safety. Using our app Augurisk now, you can set up automatic alerts on your account to get notifications on risk score changes.
Storms
Severe convective storms are frequent and extremely damaging natural disasters in the United States. Depending on atmospheric conditions, they can manifest as thunderstorms, tornadoes, hail storms, or intense winds.
Over the last decade, severe convective storms have triggered the highest losses among all the perils in North America. The accumulated insured losses from storms have exceeded losses from all primary perils together between 2011–2020. The increase in losses is driven by changes in geography, frequency and intensity of these storms, as well as population growth and economic development in the affected areas.
According to the catastrophe modeling firm RMS, the average annual insured U.S. loss from convective storms is around $17 billion. RMS warns that severe convective storm losses, especially hail, can accumulate over time and have a significant impact on the insurance industry.
Insurers, risk managers, homeowners and businesses can assess the risks of storm exposure to each property using the Augurisk Storm Event Hazard Assessment. It provides a storm hazard score for different categories of risks, including tornadoes, hurricanes, blizzards, snow and hail storms.
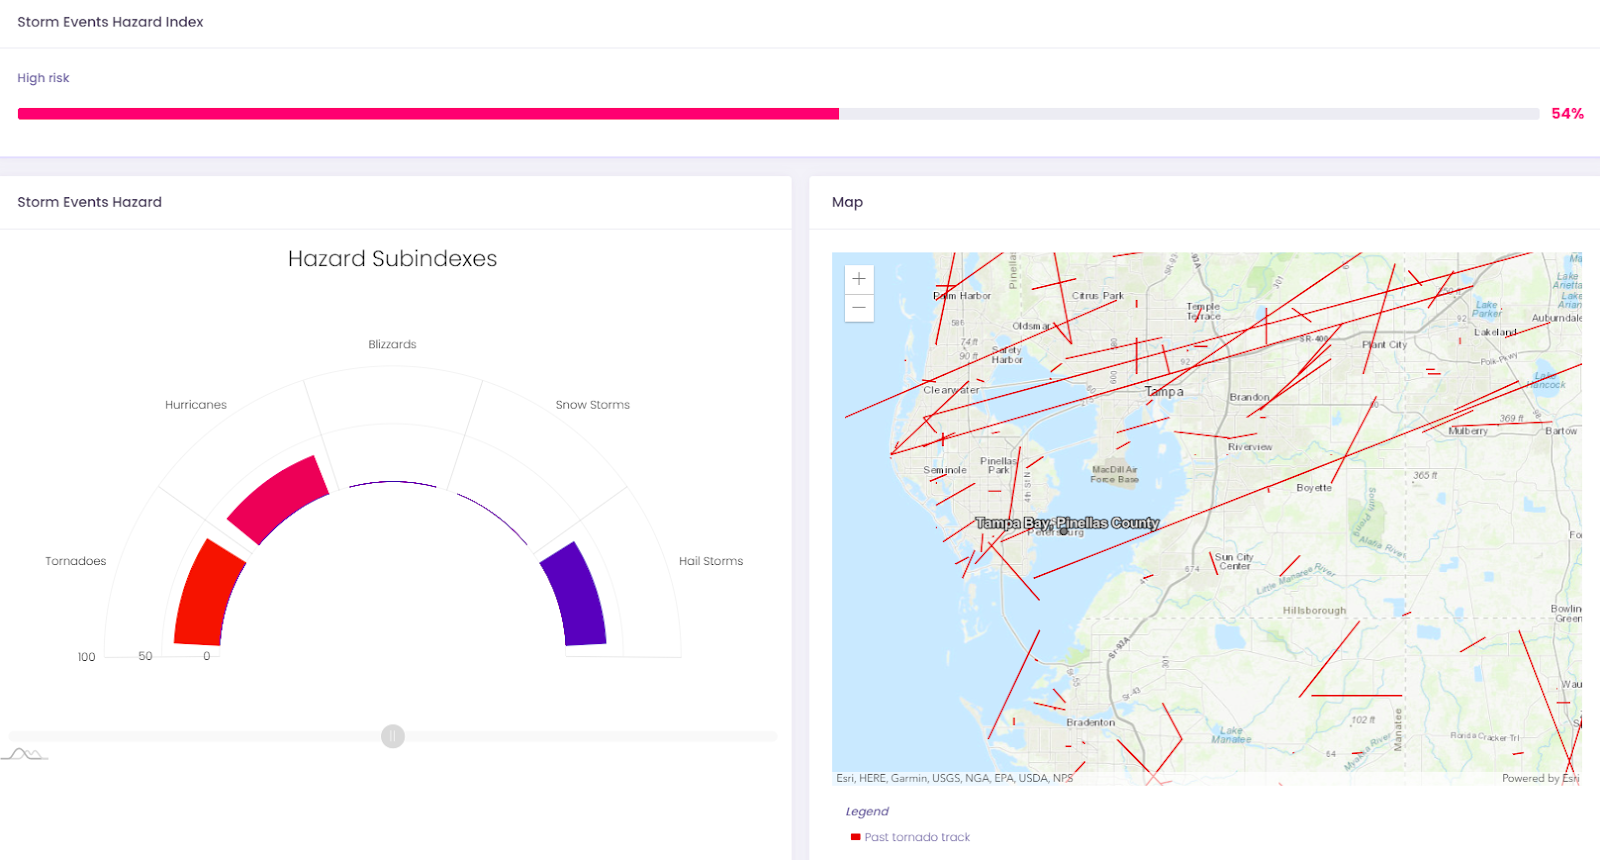
Conducting storm hazard assessments allows insurers to determine the risks from severe storms, while property owners can better understand and mitigate storm risks, improve their safety and community resilience.
Hurricanes
The Atlantic hurricane season, which usually occurs in the US from June to November, puts every coastal state from Florida to Maine at risk of storm damage. As coastal areas are increasingly developed, more properties are exposed to severe windstorms.
In states prone to hurricanes, insurers seek to limit their financial losses from natural disasters by selling insurance policies with percentage deductibles for storm damage based on the property’s insured value. For example, if a house is insured for $300,000 with a 5% deductible, the policyholder will have to pay the first $15,000 of a claim himself.
For each state, the insurance companies must determine the level of the hurricane, windstorm, wind/hail deductible, and identify in which areas they should be applied. Florida is an exception, as the state law decides these variables.
The following states and the District of Columbia have implemented hurricane deductibles: Alabama, Connecticut, Delaware, Florida, Georgia, Hawaii, Louisiana, Maine, Maryland, Massachusetts, Mississippi, New Jersey, New York, North Carolina, Pennsylvania, Rhode Island, South Carolina, Texas, Virginia, and Washington DC.
For other types of losses, like fire damage, insurers use traditional dollar deductibles.
Tornadoes
The US encounters more tornadoes than any other country, which can happen any time of the year. Every year, about 1,200 tornadoes with gusts of wind up to 200 mph hit the United States.
In general, tornadoes are not as costly in terms of insured values as hurricanes due to a more limited geographic area of impact. However, tornadoes are more frequent and can cause significant damage with many deaths. For instance, the tornado system from August 8 to 12, 2020, including the August 10 Midwest Derecho, had caused $8.3 billion in insured losses.
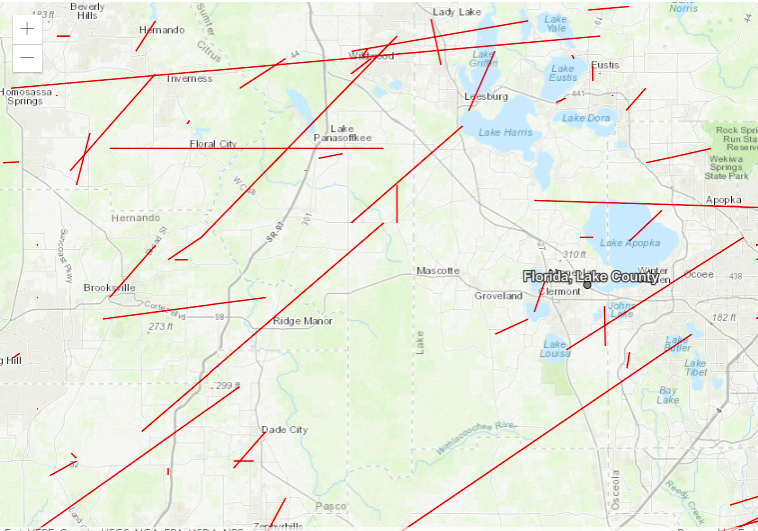
To check if properties are at elevated risk from tornado damage, Augurisk risk assessment shows the past tornado track (red) in the area.
Earthquakes
Over the last century, earthquakes hit 39 states and caused damage all over the US. On average, 5,000 earthquakes can occur each year, with around 400 capable of damaging the interior of buildings and 20 threatening structural damage. An earthquake like 1906, San Francisco (7.8 in magnitude) could nowadays cost an estimated $100 billion in insured damage.
According to FEMA, Earthquakes are estimated to cost the US about $6.1 billion annually in building stock losses. Earthquakes pose the highest risk on the West Coast. A major earthquake on the East Coast is less likely, but could cause 10 times greater damage to properties, because the seismic motion in these areas is up-and-down rather than horizontal side-to-side typical for California.
There are 16 states at highest risk of earthquakes including Alaska, Arkansas, California, Hawaii, Idaho, Illinois, Kentucky, Missouri, Montana, Nevada, Oregon, South Carolina, Tennessee, Utah, Washington, and Wyoming.
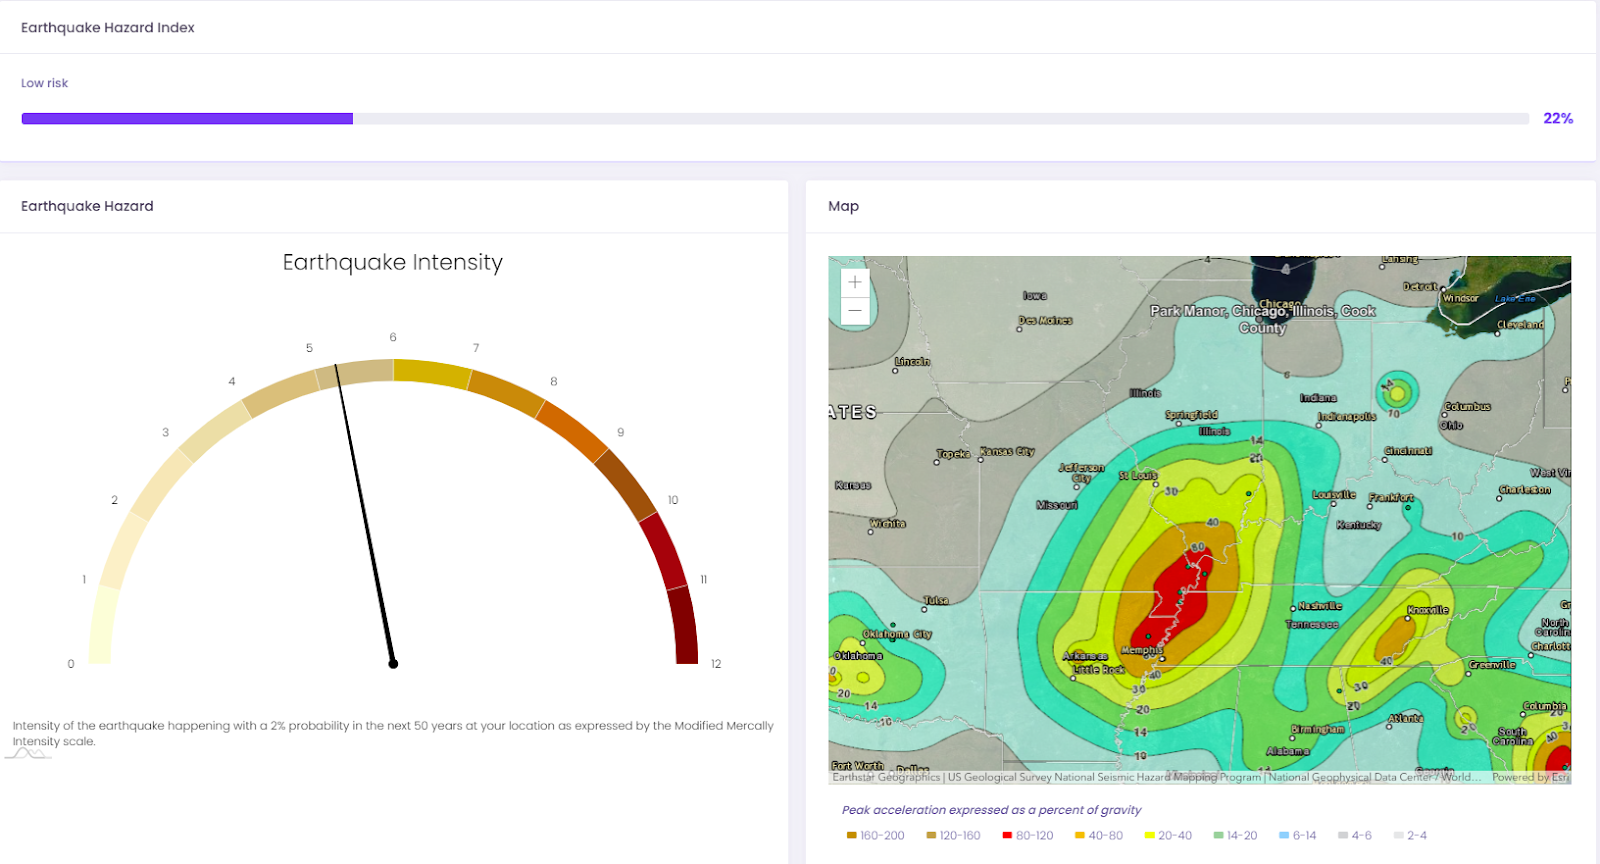
Insurers and homeowners can evaluate the risks of earthquake exposure for properties using the Augurisk Earthquake Hazard Index. It is based on the intensity of the earthquake happening in each block with a 2% probability over the next 50 years.
You will get a detailed map of earthquake hazards with different colors expressing the level of risk. In the image below, the Augurisk Earthquake Hazard assessment shows the intensity of the earthquake, which is a 2% probability in the next 50 years, with an index of 5.27. Such an earthquake could be strong. It is felt by all, and many are scared. Some heavy furniture is moved, with a few instances of fallen plaster. Slight damage can be witnessed.
Disaster risk assessment can help communities reduce their losses and improve their disaster resilience - prepare for, recover from, and adapt to natural disasters. Individuals, communities, businesses, and insurers can minimize their risks by using the Augurisk risk scores to evaluate threats to properties.
If you need assistance with your disaster risk assessment, contact us at Augurisk any time.